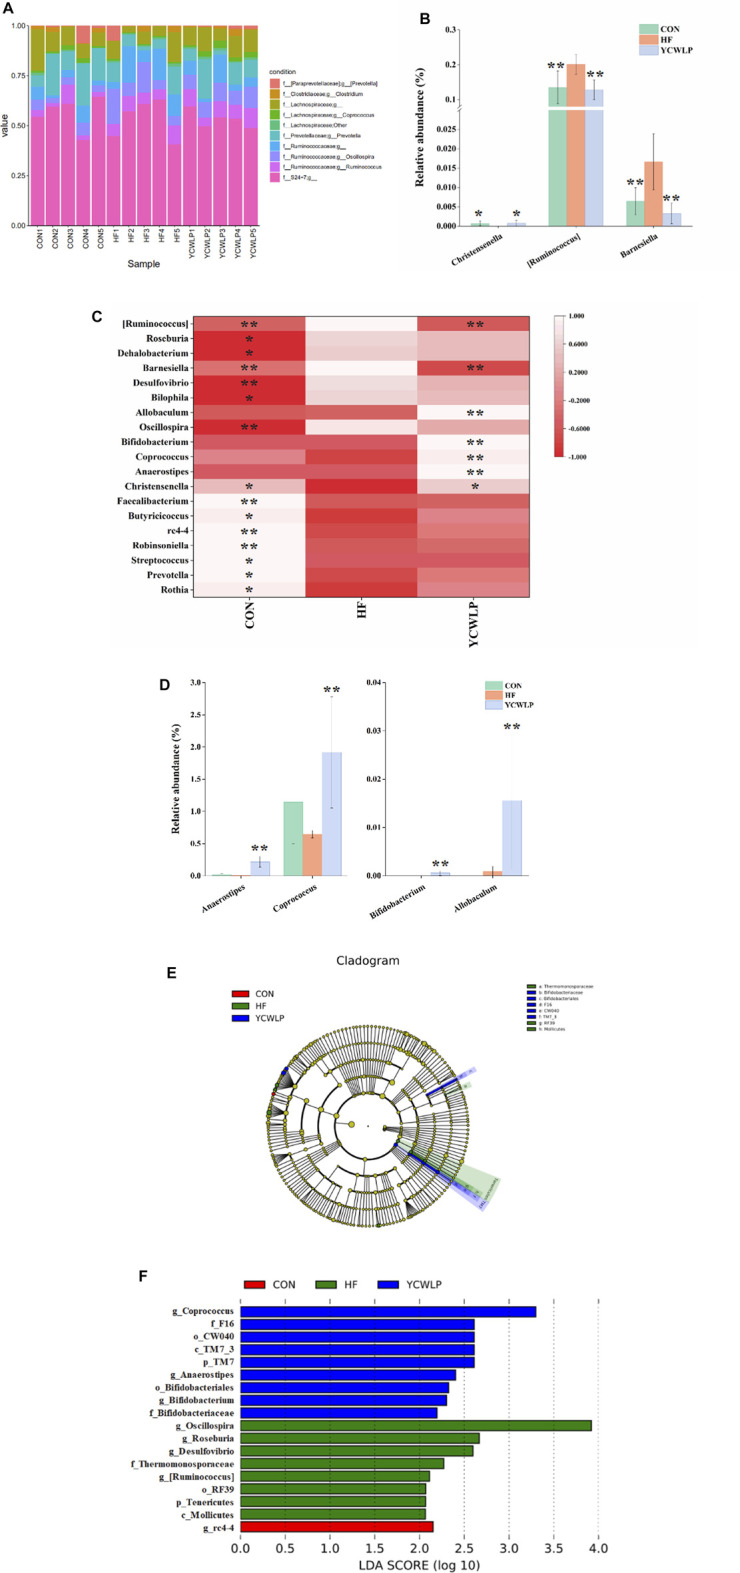
FIGURE 3.

Differences of gut microbiota composition among the CON, HF and YCWLP groups. (A) Top ten gut microbiota in the relative abundance at the genus level; (B) The relative abundance of Christensenella [Ruminococcus] and Barnesiella; (C) Heatmap of genera with significant variations; (D) The relative abundance of Anaerostipes, Coprococcus, Bifidobacterium and Allobaculum; (E) Cladogram generated by the LEfSe analysis; (F) Linear discriminant analysis (LDA) scores of the discriminative taxa. The letters p, c, o, f and g represented phylum, class, order, family and genus, respectively. Significant difference compared with the HF group: * p-value < 0.05; ** p-value < 0.01.
