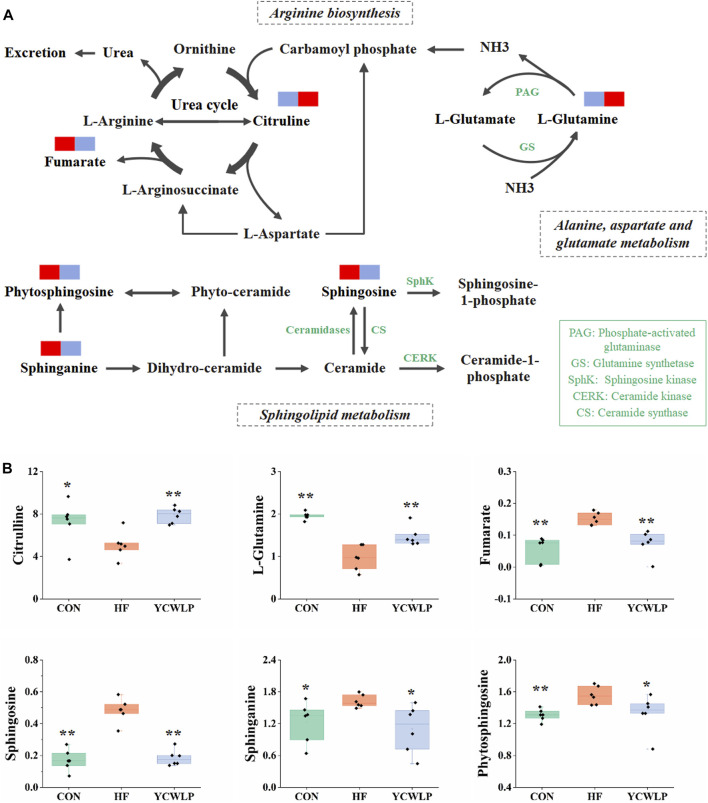
FIGURE 6.
Schematic of arginine biosynthesis, sphingolipid metabolism and alanine, aspartate and glutamate metabolism pathways (A) and the related metabolites (B). The blue rectangles in (A) represent being significantly down-regulated, and the red rectangles represent being significantly up-regulated. Significant difference compared with the HF group: * p-value < 0.05; ** p-value < 0.01.

