Fig. 2.
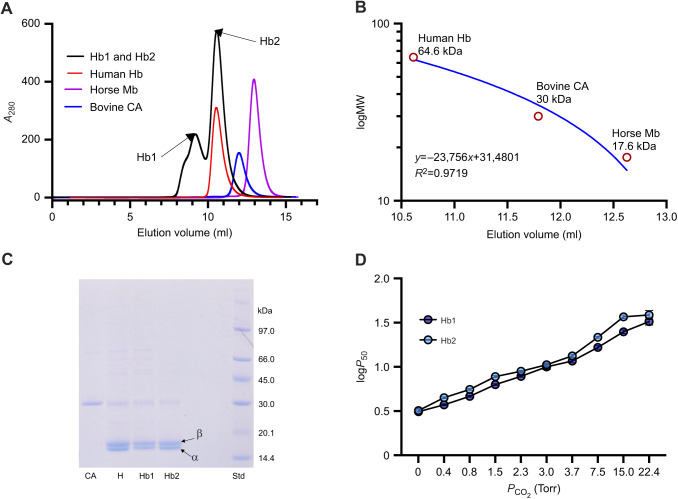
FPLC purification, SDS-PAGE and functional analysis of hemoglobin (Hb) fractions of spectacled caiman. (A) Elution profile of caiman hemolysate (absorbance at 280 nm; representative of one sample out of N=3 biological replicates), resolving in two peaks (Hb1 and Hb2) indicated by arrows, is shown superimposed on that of standard proteins with known molecular mass: human Hb (64.6 kDa), horse myoglobin (Mb, 17.6 kDa) and bovine carbonic anhydrase II (CA, 30 kDa). (B) Calibration curve by regression analysis for molecular weight (MW, kDa) against elution volume. (C) SDS PAGE under reducing conditions (10 mmol l−1 DTT) of (left to right) bovine CA II, spectacled caiman hemolysate (H), purified Hb1, purified Hb2 and standard protein (Std) as indicated. The bands corresponding to α- and β-type chains in the hemolysate and in the two purified Hb fractions are indicated. (D) logP50 measured at various PCO2 values, showing an identical effect of CO2 on the O2 affinity of purified Hb1 and Hb2 fractions (N=3).

