Fig. 7.
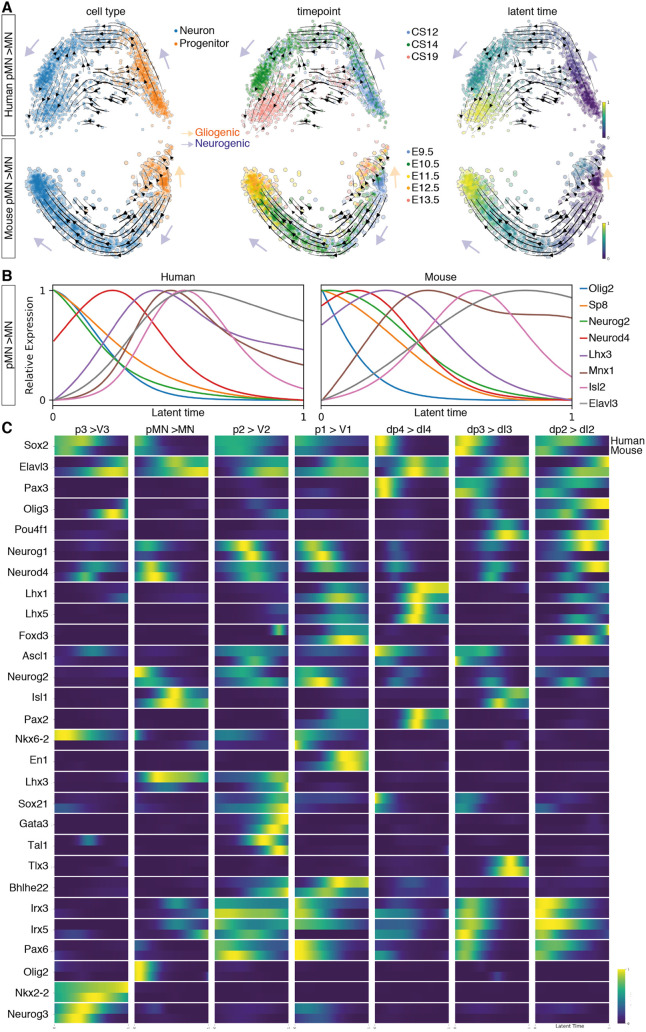
Neurogenic trajectories in the developing spinal cord. (A) PCA of the pMN-to-MN trajectory in human and mouse indicating the RNA-velocity trajectories depicted by black arrows in the PCA. PCAs are annotated by cell type (left), time point (middle) or latent time (right). The earliest latent time points are indicated in dark blue and latest in yellow on the latent time colour scale. Neurogenic trajectories are indicated with blue arrows, and the gliogenic trajectory in the mouse pMN is depicted by the orange arrow pointing away from the neurogenic trajectory. (B) Smoothed expression profile of the reconstructed motor neuron differentiation trajectory using the calculated latent times in human and mouse for selected genes. (C) Heatmap of the normalised gene expression (blue, low; yellow, high) of genes involved in neurogenesis for each neuronal class as a function of latent time in human (top bar) and mouse (bottom bar).

