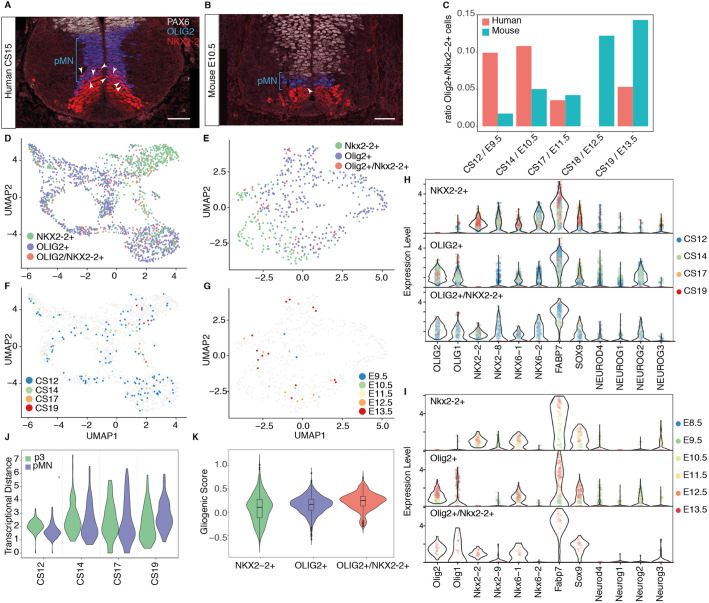
Fig. 8.
Overlapping expression of OLIG2 and NKX2-2. (A,B) Expression of the ventral progenitor markers PAX6 (white), OLIG2 (blue) and NKX2-2 (red) in transverse sections of human (A) and mouse (B) cervical neural tube at CS15 and E10.5, respectively. Scale bars: 50 µm. (C) Ratio of Olig2+/Nkx2-2+ double-positive cells within all cells expressing Nkx2-2 or Olig2. (D-G) Human UMAP of all cells expressing Nkx2-2 or Olig2 in human (D,F) and mouse (E,G). In F,G the double-positive progenitors are colour coded by time point. (H,I) Violin plots of selected genes involved in pMN and p3 neurogenesis and progenitor maturation in human (H) and mouse (I). Cells are labelled by time point. (J) Transcriptional distance of double-positive progenitors to pMN and p3 cells. Values closer to 1 indicate greater similarity to the population. (K) Gliogenic score of cells expressing OLIG2, NKX2-2 or both genes in human.

