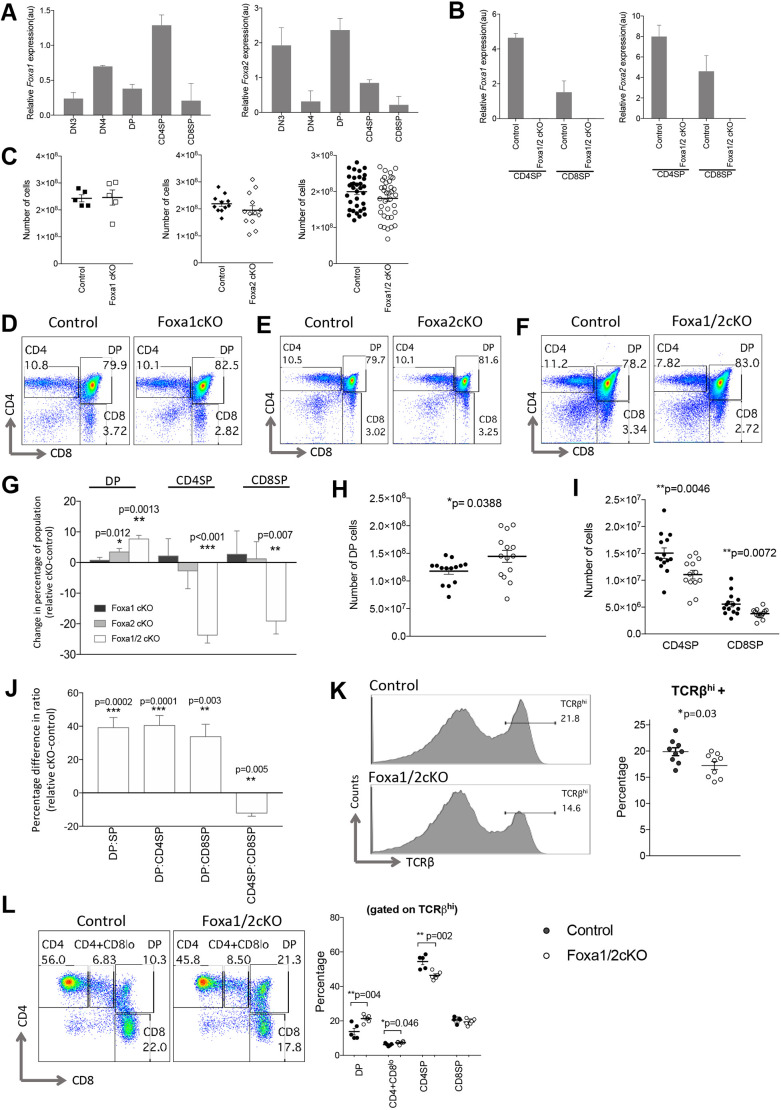
Fig. 1.
Foxa1 and Foxa2 are expressed in thymocytes and required in T-cell development. (A) Foxa1 and Foxa2 expression (relative to Gapdh) were measured by qRT-PCR in FACS-sorted thymocyte populations from wild-type (C57BL/6) adult mice: DN3 (CD4−CD8−CD25+CD44−); DN4 (CD4−CD8−CD25−CD44−); DP (CD4+CD8+); CD4SP (CD4+CD8−CD3+); CD8SP (CD4−CD8+CD3+). Bar charts show relative expression of Foxa1 (left) and Foxa2 (right) in these FACS-sorted populations. (B) Bar charts show relative expression of Foxa1 (left) and Foxa2 (right) (relative to Gapdh) measured by qRT-PCR in FACS-sorted CD4SP (CD4+CD8−CD3+) and CD8SP (CD4−CD8+CD3+) cells from Foxa1/2cKO and control thymus. (C) Scatter plots show the number of thymocytes recovered from the thymus of Foxa1cKO, Foxa2cKO and Foxa1/2cKO mice compared with control littermates. (D-F) Flow cytometry profiles show anti-CD4 and anti-CD8 staining, giving the percentage of cells in the region shown for Foxa1cKO (D), Foxa2cKO (E) and Foxa1/2cKO (F) thymus compared with control littermate thymus. (G) Bar chart shows the change in the percentage of the thymocyte population in cKO relative to control littermates (mean percentage of each population in control littermates subtracted from relative percentage of same population in conditional knockout) in Foxa1cKO, Foxa2cKO and Foxa1/2cKO thymus. For control versus Foxa1cKO: control n=5, Foxa1cKO n=5; for control versus Foxa2cKO: control n=9, Foxa1cKO n=9; for control versus Foxa1/2cKO: control n=15, Foxa1/2cKO n=16. (H,I) Scatter plots show the number of cells in DP (H) and CD4SP and CD8SP (I) populations in Foxa1/2cKO mice compared with control. (J) Bar chart shows the change in thymocyte subset ratio in Foxa1/2cKO relative to control littermates, calculated by the mean ratio of control littermates subtracted from the relative ratio from Foxa1/2cKO; control n=15, Foxa1/2cKO n=16. (K) Histograms show staining of anti-TCRβ on thymocytes, giving the percentage of TCRβhi cells in the marker shown (TCRβhi). Scatter plot shows the percentage of TCRβhi cells in control and Foxa1/2cKO littermates. Horizontal bars indicate mean. (L) Flow cytometry profiles show anti-CD4 and anti-CD8 staining of thymus, gated on the TCRβhi population, giving the percentage of cells in the regions shown. Scatter plot shows the percentage of DP, CD4+CD8lo, CD4SP and CD8SP, gated on TCRβhi in Foxa1/2cKO and control thymus. In scatter plots, each symbol represents an individual mouse, either control (black circles) or Foxa1/2cKO (white circles). Bar charts and scatter plots show mean and s.e.m., giving significance by Student's t-test: *P<0.05; **P<0.01; ***P<0.001. au, arbitrary units.

