Fig. 3.
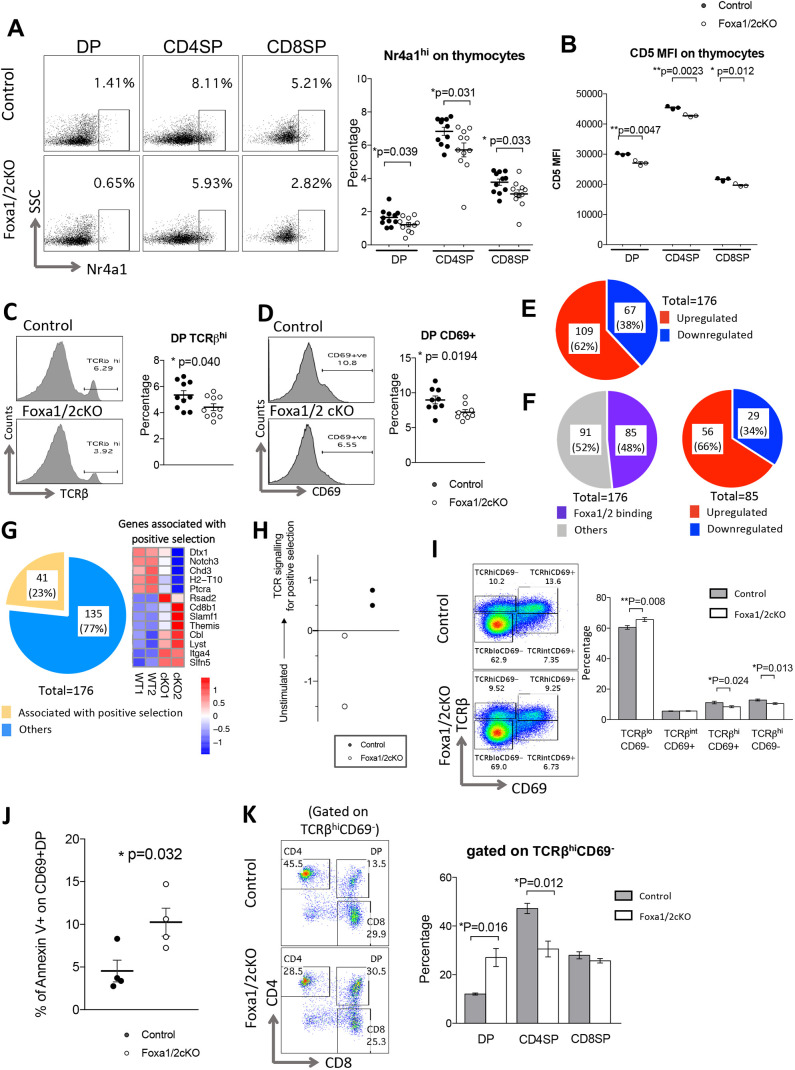
Foxa1/2 regulates TCR signal and promotes positive T-cell selection. (A) Flow cytometry profiles show intracellular anti-Nr4a1 staining, gated on DP, CD4SP and CD8SP in control and Foxa1/2cKO thymus. Scatter plot shows percentage of Nr4a1hi in DP, CD4SP and CD8SP populations. (B) Scatter plot shows MFI of anti-CD5 staining on DP, CD4SP and CD8SP populations. (C,D) Histograms show staining of anti-TCRβ (C) and anti-CD69 (D) on the DP population in control and Foxa1/2cKO thymus. Scatter plots show percentage of TCRβhi (C) and CD69+ (D) on DP populations. (E) Pie chart represents the proportion of DEGs that were upregulated (red) or downregulated (blue) in Foxa1/2cKO datasets compared with control. (F) Left: Pie chart illustrates number of DEGs that were identified as binding Foxa1/2 in genome-wide ChipSeq analysis of Foxa1/2 binding sites in neuronal progenitors (Metzakopian et al., 2012, 2015) (purple) and DEGs that were not (grey). Right: Pie chart represents the 85 DEGs that were found to be Foxa1/2-binding, as defined in F, that were upregulated (red) or downregulated (blue) in our Foxa1/2cKO datasets. (G) Pie chart represents the number of DEGs that are associated with positive selection (Kasler et al., 2011) (yellow) and that are not associated with positive selection (blue). Pearson correlation clustering heatmap shows expression of selected positive selection-associated DEGs in control and Foxa1/2cKO, where red represents higher expression and blue lower expression on a linear correlation scale. A value of 1 indicates a positive association, a value of −1 indicates a negative association, and a value of 0 indicates no association. (H) Scatter plot shows canonical correspondence analysis on a scale of unstimulated to TCR-signalling-for positive-selection (Lo et al., 2012). (I) Flow cytometry profiles show anti-TCRβ and anti-CD69 staining, giving the percentage in regions shown for TCRβloCD69− (pre-selection), TCRβintCD69+ (selecting), TCRβhiCD69+ (post initiation of positive selection) and TCRβhiCD69− (mature). Histogram shows the mean percentage of cells in these four subsets, defined by staining against TCRβ and CD69. (J) Scatter plot shows the percentage of annexin V+ cells in the CD69+DP population. (K) Flow cytometry profiles show anti-CD4 and anti-CD8 staining gated on the TCRβhiCD69− population. Histogram shows the mean percentage of each thymocyte subpopulation, gated on TCRβhiCD69−. In scatter plots, each symbol represents an individual mouse, either control (black circles) or Foxa1/2cKO (white circles). Scatter plots and bar charts show mean and s.e.m., giving significance by Student's t-test: *P<0.05; **P<0.01.

