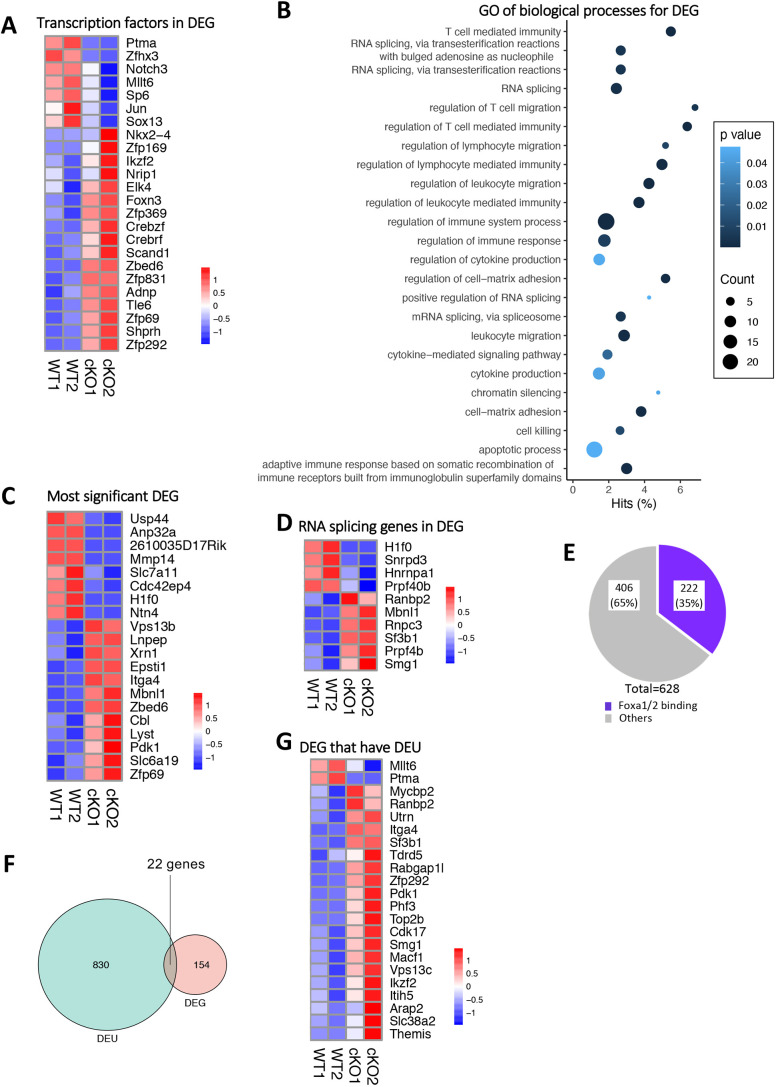
Fig. 4.
Foxa1/2 deficiency disturbs exon usage in developing T cells. (A) Pearson correlation clustering heatmap shows expression of DEGs that encode transcription factors in control and Foxa1/2cKO, where red represents higher expression and blue lower expression on a linear correlation scale. A value of 1 indicates a positive association, a value of −1 indicates a negative association, and a value of 0 indicates no association. (B) Dot plot of Gene Ontology (GO) analysis of biological processes associated with 176 DEGs. The y-axis represents the biological process GO terms and the x-axis represents the percentage of genes found in that GO term category. Dot size represents the number of genes and the colour indicates the P-value. (C) Pearson correlation clustering heatmap shows expression of the 20 most significant DEGs in control and Foxa1/2cKO, where red represents higher expression and blue lower expression on a linear correlation scale. A value of 1 indicates a positive association, a value of −1 indicates a negative association, and a value of 0 indicates no association. (D) Pearson correlation clustering heatmap shows expression of DEGs associated with RNA splicing in control and Foxa1/2cKO, where red represents higher expression and blue lower expression on a linear correlation scale. A value of 1 indicates a positive association, a value of −1 indicates a negative association, and a value of 0 indicates no association. (E) Pie chart illustrates the number of genes showing DEU: purple section represents the number of genes that are identified as Foxa1/2 targets in genome-wide ChipSeq analysis of Foxa1/2-binding sites in neuronal progenitors (Metzakopian et al., 2012, 2015). (F) Proportional Venn diagram illustrates the intersection between DEGs and genes showing DEU. (G) Pearson correlation clustering heatmap shows expression of the 22 DEGs that show DEU, where red represents higher expression and blue lower expression on a linear correlation scale. A value of 1 indicates a positive association, a value of −1 indicates a negative association, and a value of 0 indicates no association.

