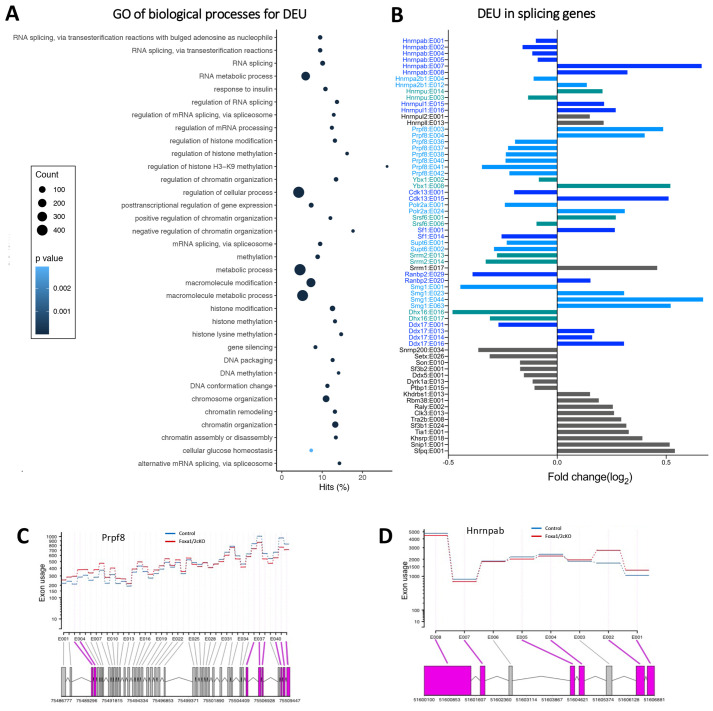
Fig. 5.
Foxa1/2 regulate alternative splicing of splicing factors. (A) Dot plot of Gene Ontology (GO) analysis for genes showing DEU. Biological processes involving pioneer function, methylation, metabolic processes and RNA splicing are shown. The y-axis represents the biological process GO terms and the x-axis represents the percentage of genes found in that GO term category. Dot size represents the number of genes and the colour indicates the P-value. (B) Bar chart shows genes that contain DEU which are involved in mRNA splicing. Genes shown in colour show multiple DEU, genes in grey show single differential exon changes. (C,D) DEXSeq representations of Prpf8 (C) and Hnrnpab (D) that show significant DEU between Foxa1/2cKO (red) in comparison with control (blue). The exons highlighted in pink have DEU (FDR-adjusted P≤0.05).

