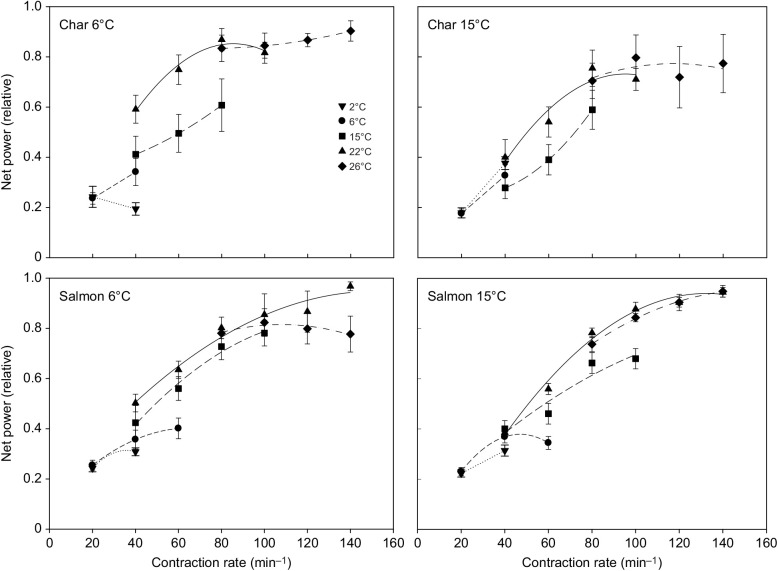
Fig. 3.
Net power produced by ventricular muscle strips (trabeculae) from 6°C- and 15°C-acclimated Arctic char and Atlantic salmon at a range of test temperatures and contraction frequencies. Power is expressed relative to the maximal net power produced for each preparation. The key shows the test temperature at which measurements were made. Each panel shows results for a given species and acclimation state (char 6°C acclimated N=8, char 15°C acclimated N=9, salmon 6°C acclimated N=10, salmon 15°C acclimated N=11). The highest contraction rate shown at each test temperature is the fastest the heart could be paced and still follow the stimulus, and is thus the maximal heart rate achievable at that temperature. Values are means±s.e.m. For mass-specific values and statistical comparisons, see Table 4. There was a significant effect of temperature on maximal net power (i.e. the largest values attained, P<0.001) and on the contraction frequency at which maximal power was attained (P<0.001) in all species and acclimation states.

