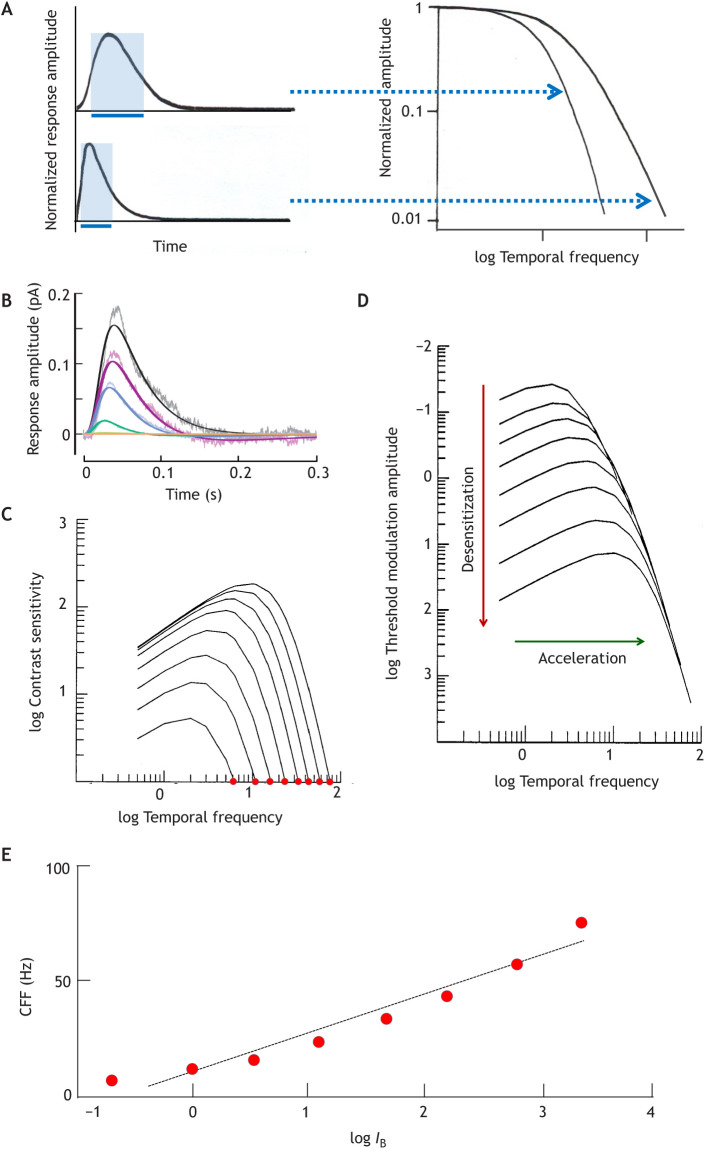
Fig. 1.
Relationships between common temporal response measures in the linear response domain. (A) Impulse responses (left) and corresponding temporal modulation transfer functions (TMTFs, right). The high-frequency limb of the TMTF extends to higher frequencies for the faster impulse response. The impulse response may be thought of as the ‘memory trace’ of a photon, to which the traces of subsequent photons can add. For some purposes, this can be expressed as a sharp interval, the summation or integration time ti, equal to the base (blue bars) of a rectangle with the same time integral (area) and the same height as the impulse response (shaded blue rectangles). For impulse responses of constant shape, ti is proportional to the time to peak (tp). (B) Physiological impulse responses: single-photon responses of a macaque cone (linear-range flash responses divided by flash intensity [R*]) in darkness (largest response) and under four intensities of steady adapting background light (IB; from ∼103 to ∼106 R* s−1) (Angueyra and Rieke, 2013). The noisy traces are recordings, the smooth traces model fits. Temperature was 32°C. (C,D) Psychophysical TMTFs: foveal (cone-driven) flicker sensitivity functions at eight different mean luminances over a ∼3.5 log unit range. The families of curves were generated by the cone-inspired model of Rovamo et al. (1999) with the parameters that provided the best fit to their entire dataset (data points suppressed for clarity). Temporal frequency is in Hz. In C, sensitivity is the inverse of the threshold modulation contrast, whereas D plots threshold modulation amplitude (increasing downwards). The leftmost curve in C and the top curve in D correspond to the lowest IB. (E) Critical flicker (fusion) frequency (CFF) as a function of mean light intensity (logIB). Data points from C for log contrast sensitivity 0 (100% modulation, red dots) were fitted with a least-squares regression line (CFF=16.8logIB+10.5).

