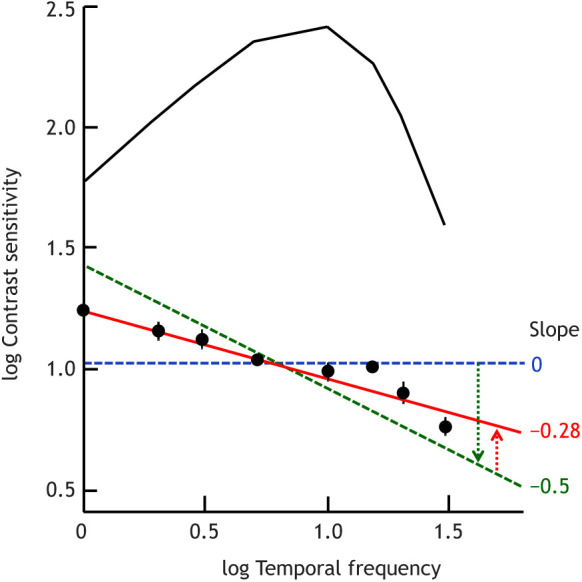
Fig. 2.

Separating effects of retinal filtering and detection in the brain on psychophysical flicker sensitivity functions. The symbols show means±s.d. of sensitivities measured with foveal flickering fields of five sizes (0.049–12.6 deg2) with added dominant purely temporal white noise (based on data from Rovamo et al., 2000). Temporal frequency is in Hz. The red line is a least-square fit. Shown for comparison is the familiar bandpass function recorded without added noise (black curve, cf. Fig. 1C), reflecting retinal filtering. The blue and green dashed lines are explained in the main text.
