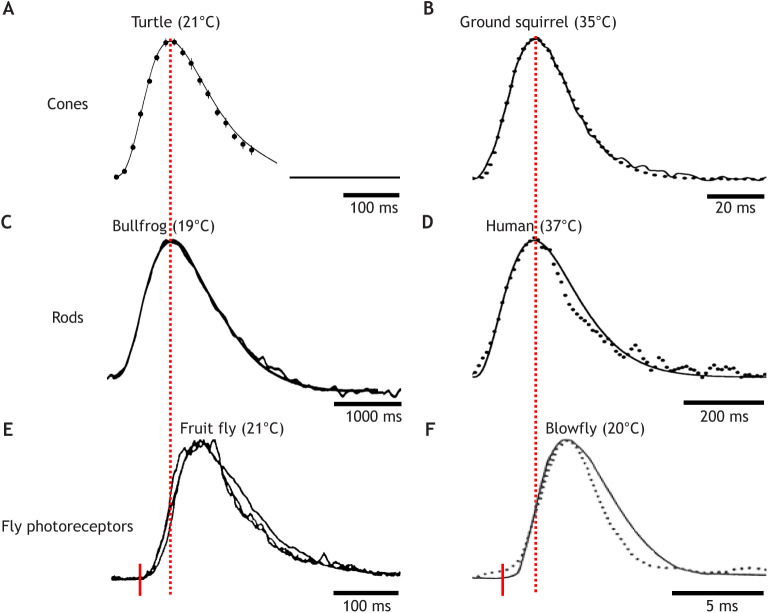
Fig. 3.
Impulse responses of vertebrate cones and rods and fly photoreceptors have similar waveforms. (A–E) Dark-adapted linear-range flash responses normalized to the same time to peak (tp), amplitude and polarity. Noisy traces are recordings, smooth traces model fits (see Box 2). Flash onset is at the start of each trace; the true time scales are indicated by the scale bars beneath the responses. Normalization of the fly responses (E and F) to the vertebrate responses was done as if the flash had occurred at the red tick, i.e. disregarding the ‘dead-time’. (A) Reptile L-cone voltage (Trachemys scripta elegans) (Baylor et al., 1974a,b). (B) Mammalian L-cone current (Citellus lateralis) (Kraft, 1988). (C) Amphibian rod current (Lithobates catesbeianus) (Donner et al., 1990a). (D) Human rod current (Kraft et al., 1993). (E) Fruitfly photoreceptor current (Drosophila melanogaster, late-stage pupa of Shaker mutant) (Hardie, 1991). (F) Blowfly photoreceptor voltage (Calliphora erythrocephala), moderately light adapted (Weckström et al., 1988). Continuous line, dim-flash response; dotted trace, impulse response obtained by inverse fast Fourier transform (see Glossary) from the recorded TMTF.

