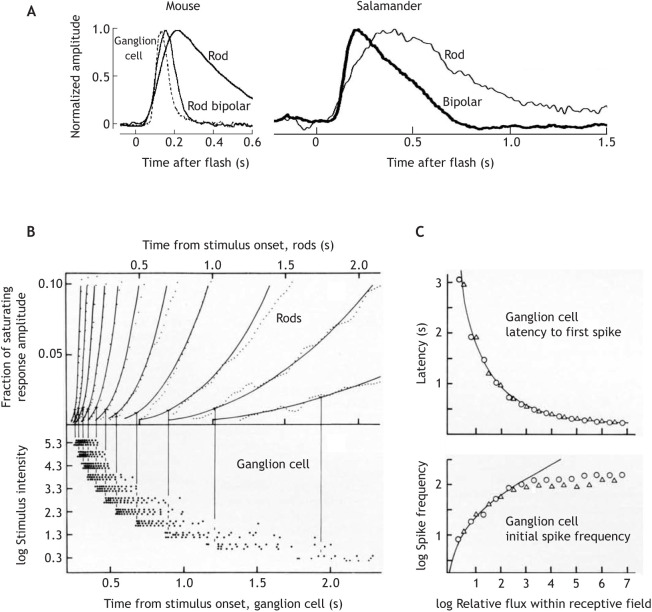
Fig. 4.
The importance of the leading edge of photoreceptor responses: retinal transmission of rod signals and readout by ganglion cells. (A) Responses to dim light flashes recorded in the dark-adapted mouse and salamander retina, showing high-pass (or band-pass) filtering of the rod signal during retinal transmission to bipolar and ganglion cells. Left: current responses of a mouse rod, rod bipolar and ON-ganglion cell (GC) (body temperature). Right: current responses recorded simultaneously in a salamander rod and ON-bipolar cell (Ambystoma tigrinum, room temperature). The rod responses have been flipped vertically to agree in polarity with those of the higher-order cells. After Field et al. (2005). (B) Relationship between rod and GC responses in the dark-adapted frog retina (Rana temporaria, 11°C) to steps of light of the same 11 intensities (from 2 to 2×10⁵R* rod−1 s−1 as indicated on the lower ordinate). Top: the leading edge of rod responses recorded by transretinal ERG (noisy dotted traces), fitted by a family of model responses (smooth curves, see Box 2). Bottom: spike responses of a class 3 (ON–OFF; Lettvin et al., 1959) GC to a small stimulus spot (much smaller than the retinal field, RF), extracellularly recorded in the eyecup. Each dot marks one spike; each line of dots is the response to one stimulus presentation. Vertical lines mark the mean latency of three responses to the same intensity. The family of GC responses has been shifted leftwards by 200 ms relative to the rod responses to account for a constant rod-to-GC transmission delay. (C) Top: latency from the onset of a step stimulus to the first spike. Bottom: initial spike frequency (s−1) over the first four spikes, recorded in another dark-adapted class 3 GC. Both are plotted as functions of log photon flux [R* s−1] summed over the RF, relative to threshold flux. Triangles, stimulus spot much smaller than the RF; circles, spot larger than the RF. The smooth curves are model functions calculated on the assumptions that (1) the first spike occurs when the rod response linearly summed over the RF has reached a criterion amplitude, plus a constant ‘transmission delay’; (2) the initial spike frequency is determined by the steepness of the leading edge of the summed rod response over a short interval after that. After Donner (1989).

