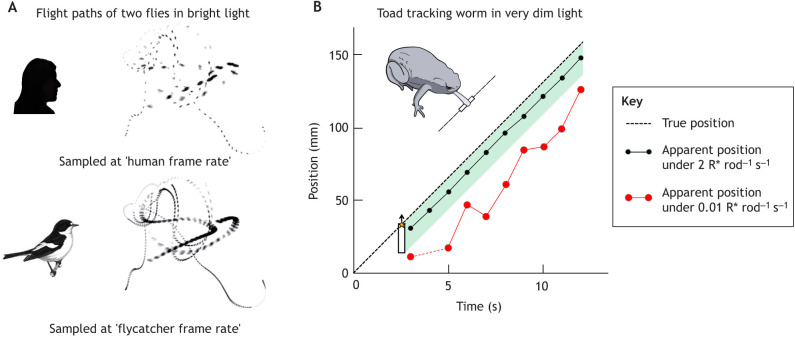
Fig. 5.
Prey-tracking and motion extrapolation. (A) The flight paths of two blowflies sampled at frame rates of 40 and 120 Hz, corresponding to human and flycatcher CFF at a fairly high luminance level (after Boström et al., 2016). (B) Prey capture in very dim light by the toad Bufo bufo (temperature 15°C). White worm dummies illuminated from above moved at constant speed against a black background. The dashed straight line shows the actual position of the worm's head as a function of time. The dots connected by lines indicate the apparent position of the worm's head based on the information that the retina sends to the brain at each moment. These have been calculated from the (variable) latencies of single responses of a GC stimulated repeatedly with the retinal image of the worm at two illumination levels: ∼1% of full moonlight (black) and 200-fold lower illumination (red). The green-shaded area is a zone of ‘acceptable’ mislocalizations, where snaps would still hit the worm.

