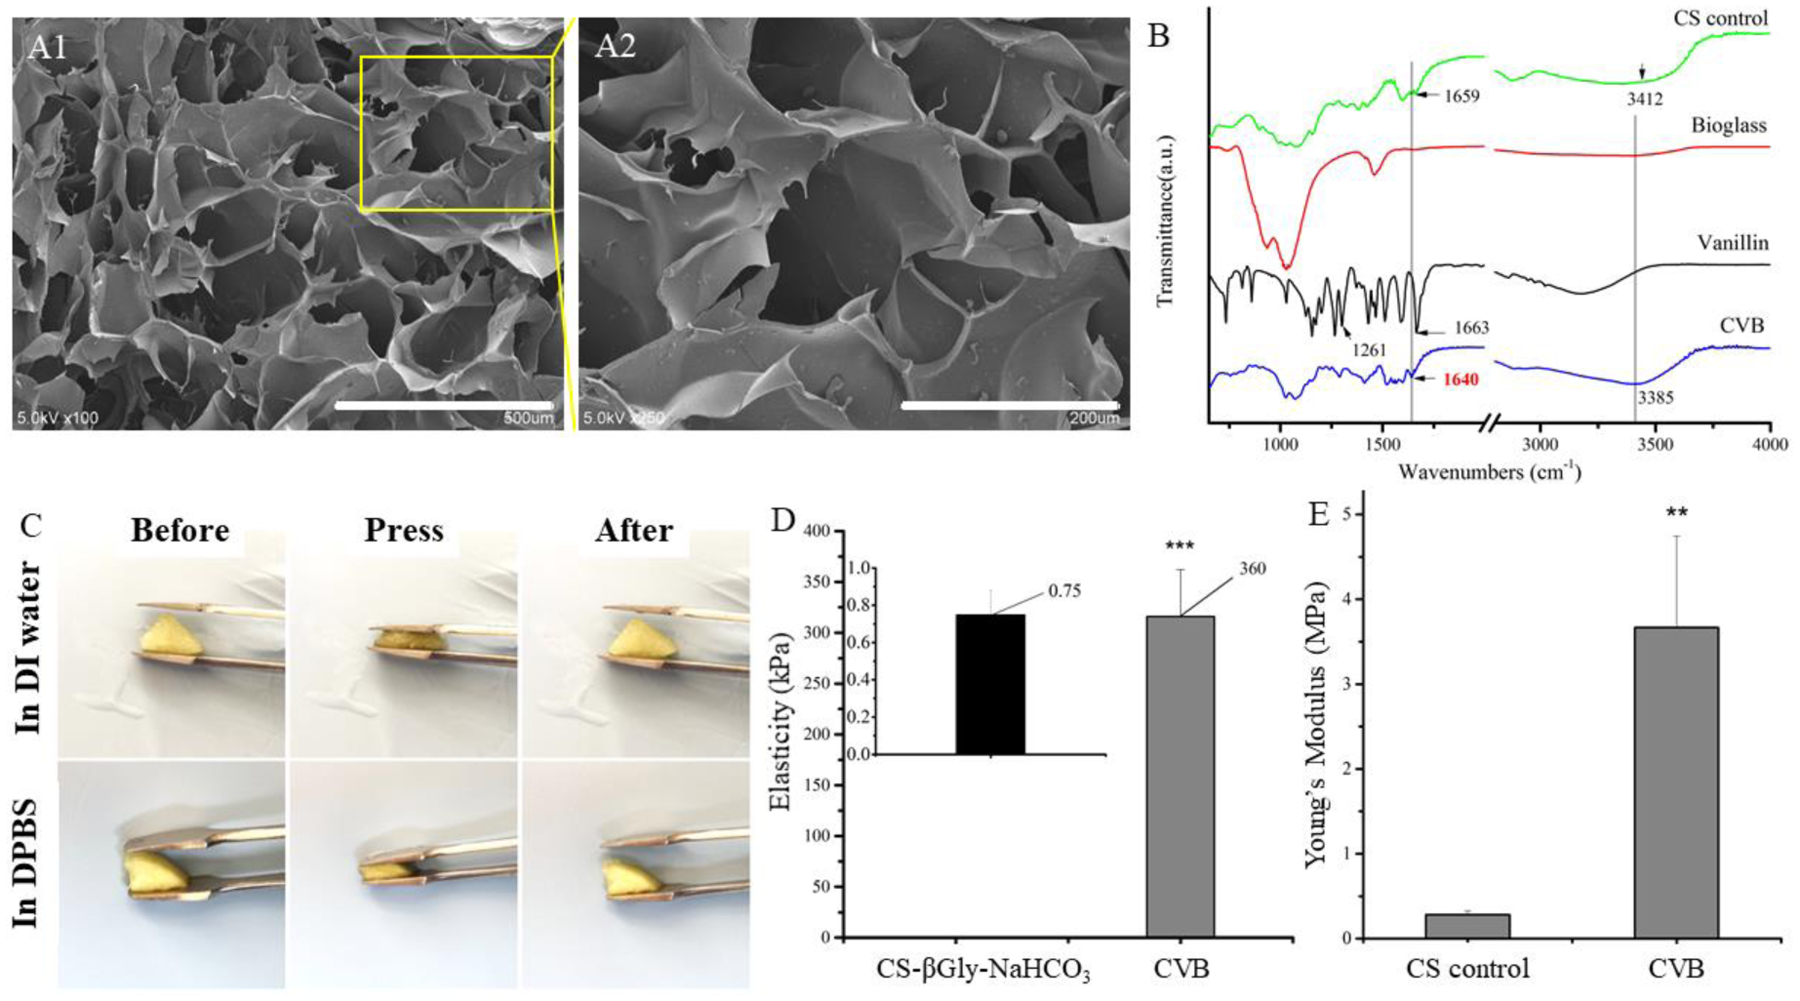
Figure.2.

Characterization of CVB and control scaffolds. (A1–A2) SEM images of CVB scaffolds at low (scale bars=500 μm, left panel) and high (scale bars=200 μm, middle panel) magnifications, (B) FTIR spectrum of CVB scaffolds, (C) Highly elastic CVB scaffolds in aqueous buffer, (D) Young’s modulus examination of CVB hydrogel and CS-βGly-NaHCO3 hydrogel has been measured using AFM analysis (wet), (E) compression Young’s modulus testing of CVB and CS scaffolds (dry).
