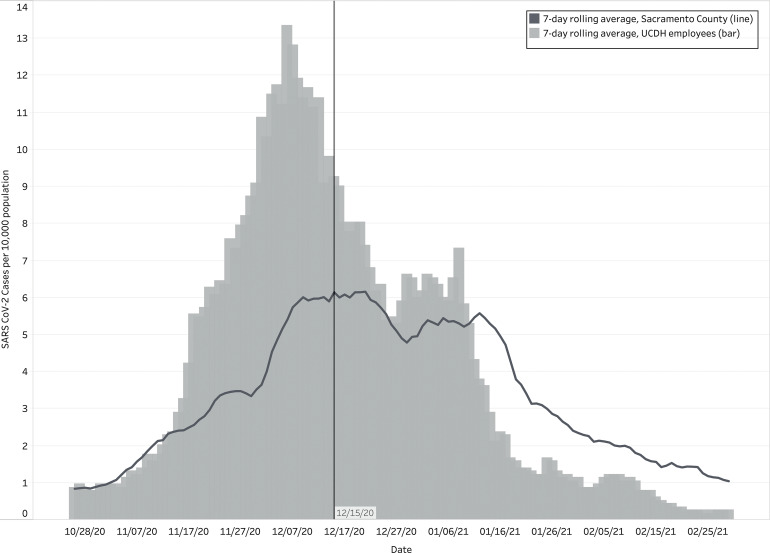
Fig. 2.
Sacramento County and UCDH employee SARS-CoV-2 incidence rate per 10,000 persons, by date. This figure shows the SARS-CoV-2 incidence rates per 10,000 persons as a seven-day rolling average for both Sacramento County (dark grey line) and UCDH employees (light grey bars) during the study period from October 20, 2020, to March 1, 2021.

