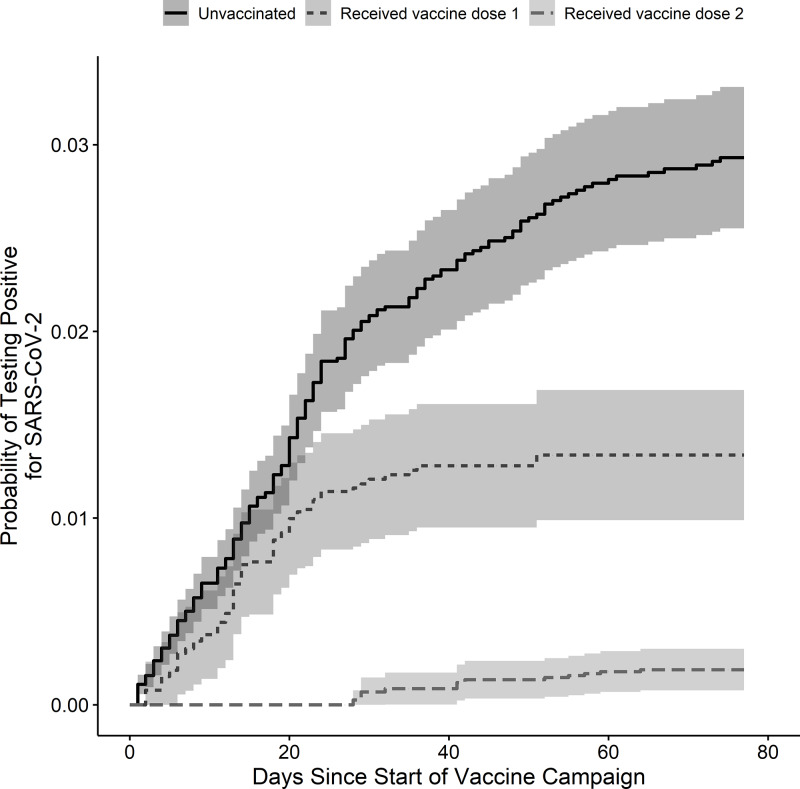
Fig. 3.
Proportional hazards model of the effect of vaccination on the probability of testing positive for SARS-CoV-2. The figure shows the probability of a positive SARS-CoV-2 test in the study population after the start of a healthcare system-wide COVID-19 vaccination campaign using proportional hazards models. The risk was evaluated for 3 groups: (1) unvaccinated individuals (solid line), (2) individuals who received 1 dose of SARS-CoV-2 vaccine (short-dashed line), and (3) individuals who received both doses of SARS-CoV-2 vaccine (long-dashed line). Shaded areas represent 95% confidence intervals.

