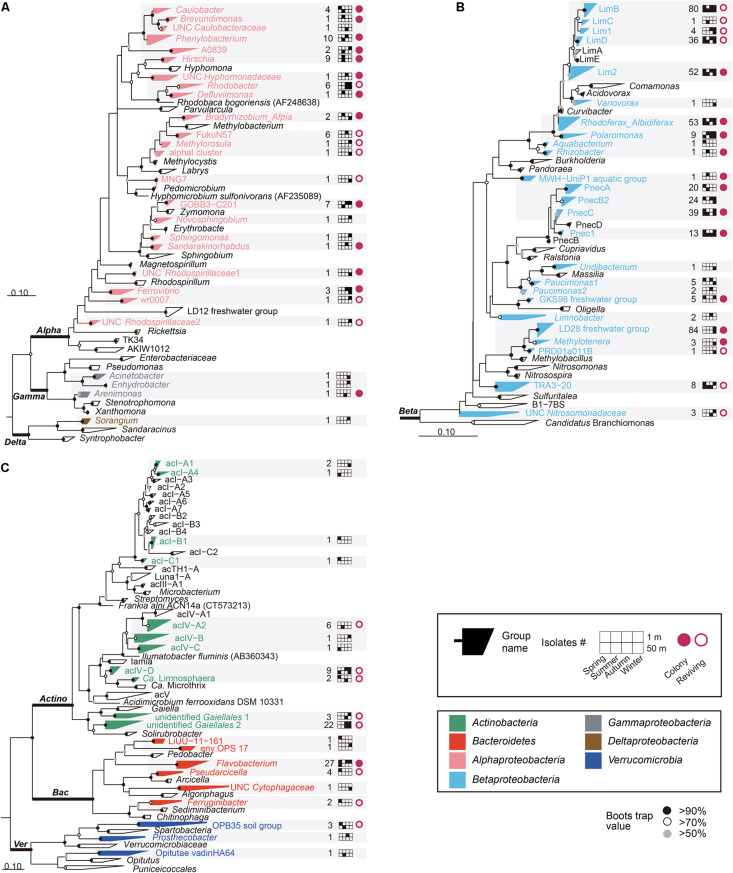
FIGURE 1.
Maximum-likelihood phylogenetic trees based on 16S rRNA gene sequences showing the positions of the cultivated isolates within (A) Alphaproteobacteria, Gammaproteobacteria, and Deltaproteobacteria; (B) Betaproteobacteria; (C) Actinobacteria, Bacteroidetes, and Verrucomicrobia. Bacterial/group names are listed at the end of the tree tips. The phylogenetic groups represented by the HTC strains isolated in this study are displayed in different colors depending on the different phyla/classes, along with the number of isolates, information on seasons and depths, and colony-forming and reviving capability. UNC: uncultured. Bootstrap supporting values are shown at the nodes as filled solid circles (>90%), empty circles (>70%), and gray circles (>50%).

