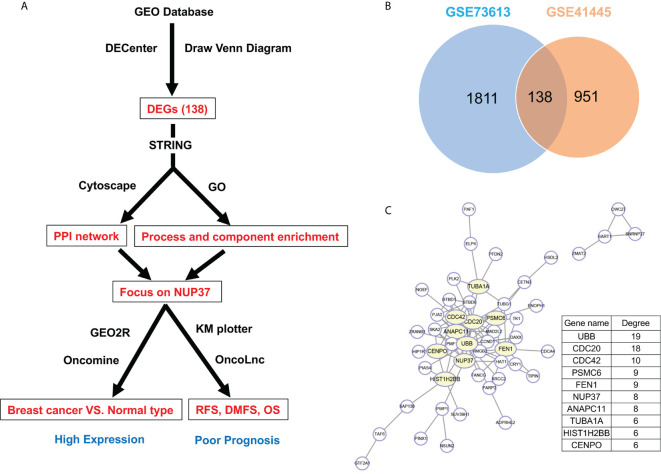
Figure 1.
Gene screening and identification of the hub gene. (A) Illustrates the screening process of key gene in a simplified sequence flow diagram. (B) Identification of up-regulated DEGs in BRCA compared with normal control samples from GEO datasets (GSE73613, GSE41445). (C) PPI networks map of upregulated DEGs. The top 10 node genes with higher degrees are labeled in yellow, and the degree of the top 10 node genes are listed.

