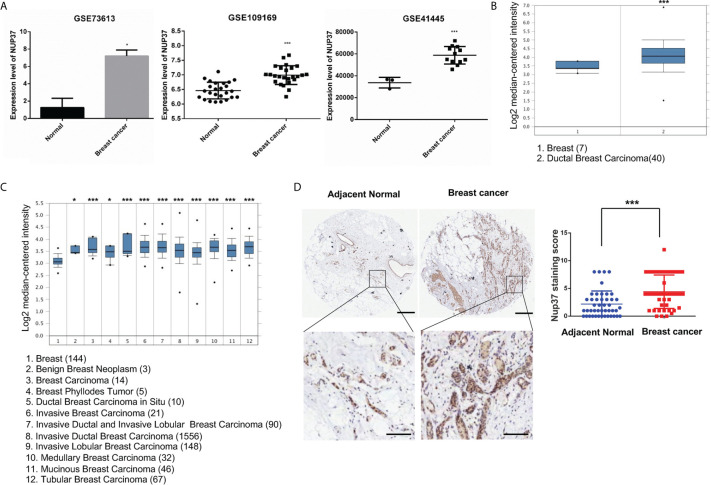
Figure 2.
The expression level of NUP37 in BRCA versus normal samples. (A) Expression level of NUP37 in BRCA and normal samples from GEO datasets (GSE73613, GSE109169, GSE41445) (Unpaired t test, Cancer VS.. Normal, p*<0.05, p***<0.001). (B) Oncomine data mining analysis of NUP37 mRNA levels in Richardson Breast 2 Dataset and (C) Curtis Breast Dataset between normal breast versus breast cancer subtypes. (Unpaired t test, Cancer VS. Normal, p*<0.05, p***<0.001) (D) Nup37 protein level in breast cancer tissue versus adjacent normal tissue for human tissue microarray staining of 45 patients. The representative image of staining tissue (left) and statistic staining score (right) (Unpaired t test, p***<0.001). Scale bar, 400 μm,above; 100 μm, below.

