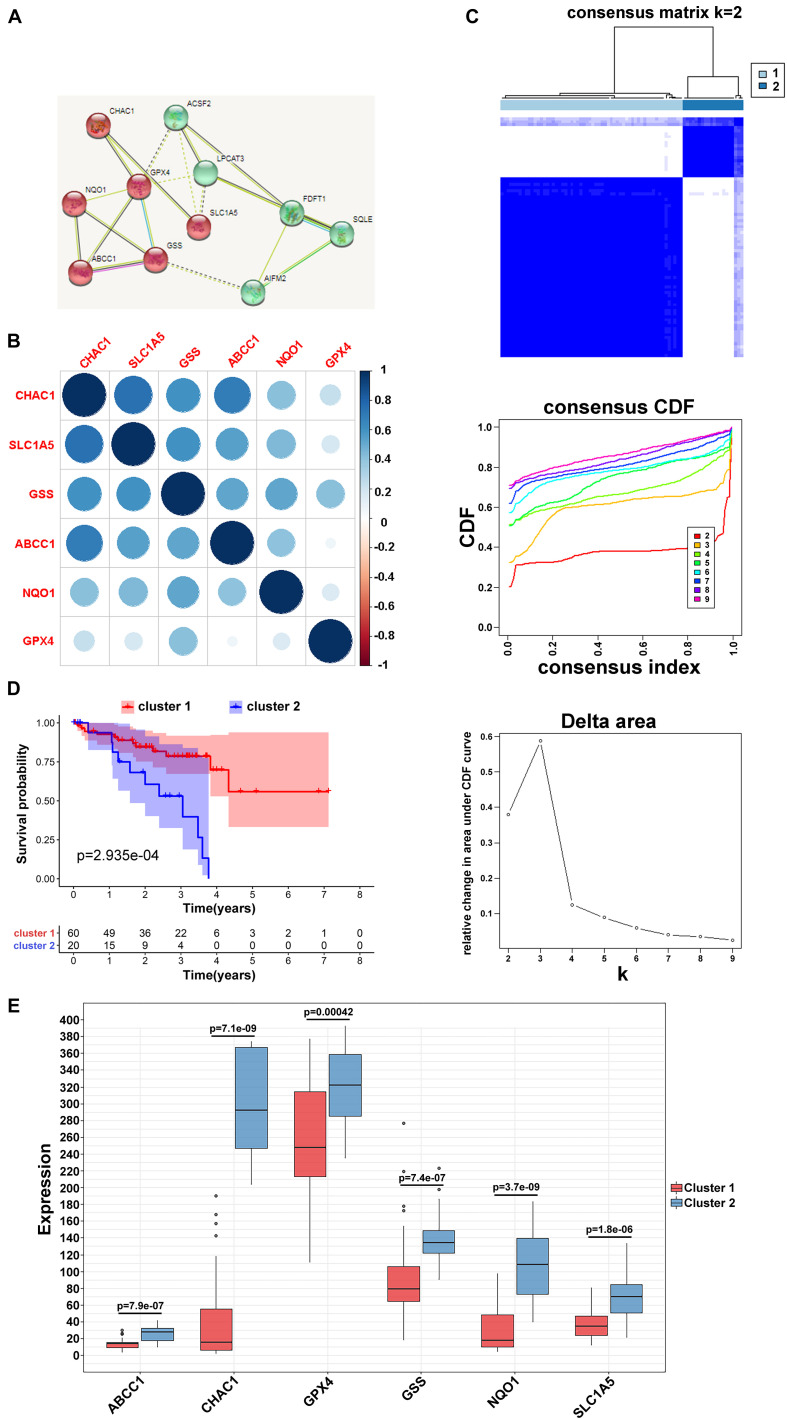
FIGURE 2.
Clustering of ferroptosis-related genes. (A) MCL clustering of ferroptosis-related genes. (B) Pearson correlation analysis among ferroptosis-related regulators in module A. (C) Consensus clustering cumulative distribution function (CDF) and relative change in area under CDF curve for k = 2 in module A. (D) Kaplan–Meier curves of two clusters in UVM about OS in module A. (E) The different expression of the ferroptosis-related mediators in two clusters based on module A.

