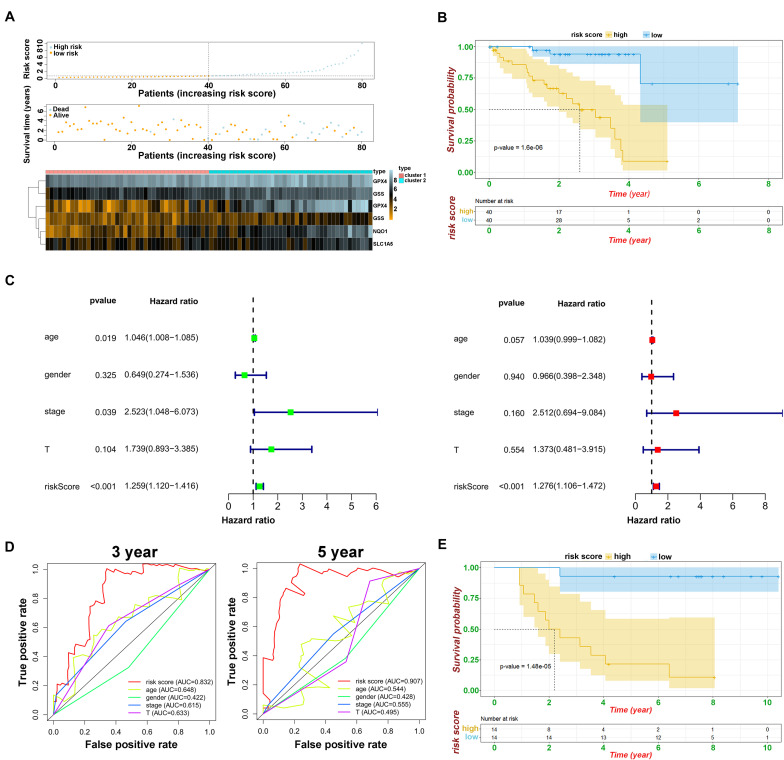
FIGURE 5.
Prognostic analysis of risk model and ferroptosis-related genes. (A) The distributions of risk scores, alive/dead status, and expression of ferroptosis-related genes in module A. (B) Kaplan–Meier curves of patients in high/low risk about OS in module A. (C) Univariate (above) and multivariate analysis (below) of clinical characteristics. (D) ROC curve of risk score and clinical characteristics in module A. (E) Kaplan–Meier curves of patients in high/low risk about OS based on GSE84976.

