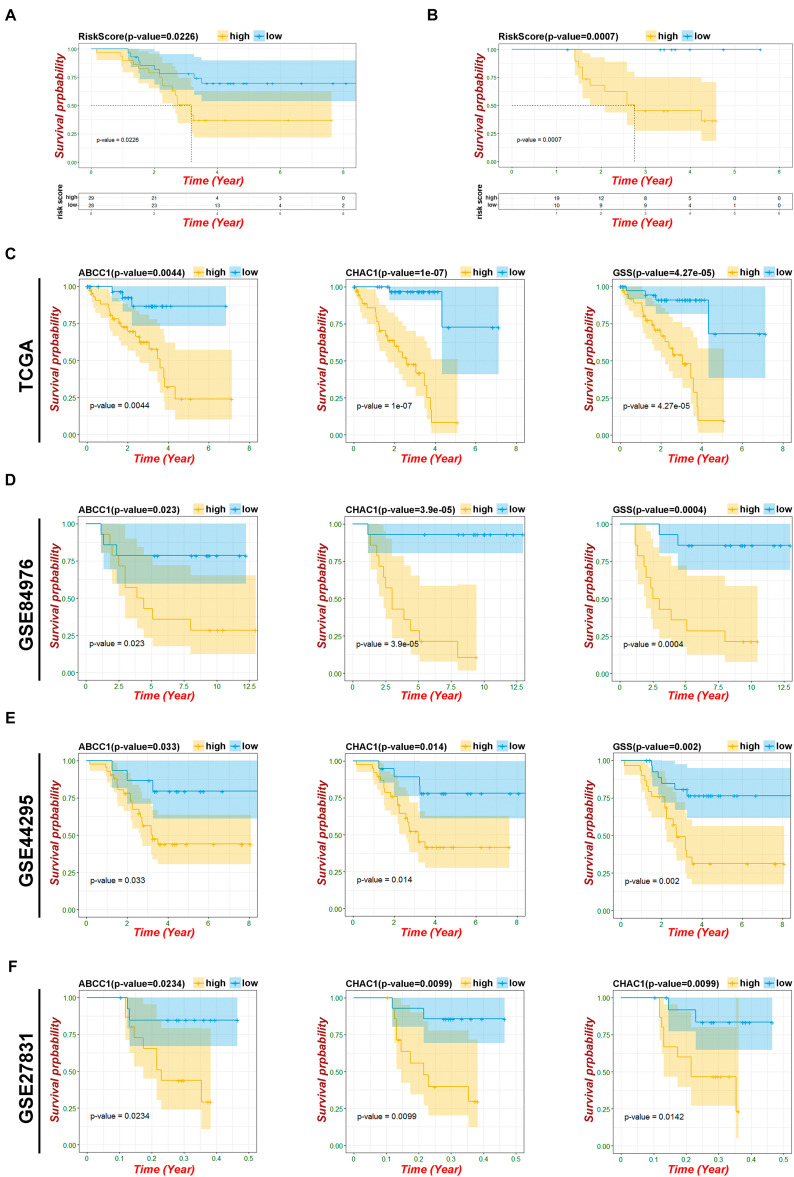
FIGURE 6.
Verification of risk model and ferroptosis-related genes. (A) Kaplan–Meier curves of patients in risk model about OS based on GSE44295. (B) Kaplan–Meier curves of patients in risk model about PFS based on GSE27831. (C) Kaplan–Meier OS curves for patients in key ferroptosis-related genes based on TCGA. (D) Kaplan–Meier OS curves for patients in key ferroptosis-related genes based on GSE84976. (E) Kaplan–Meier OS curves for patients in key ferroptosis-related genes based on GSE44295. (F) Kaplan–Meier PFS curves for patients in key ferroptosis-related genes based on GSE27831.

