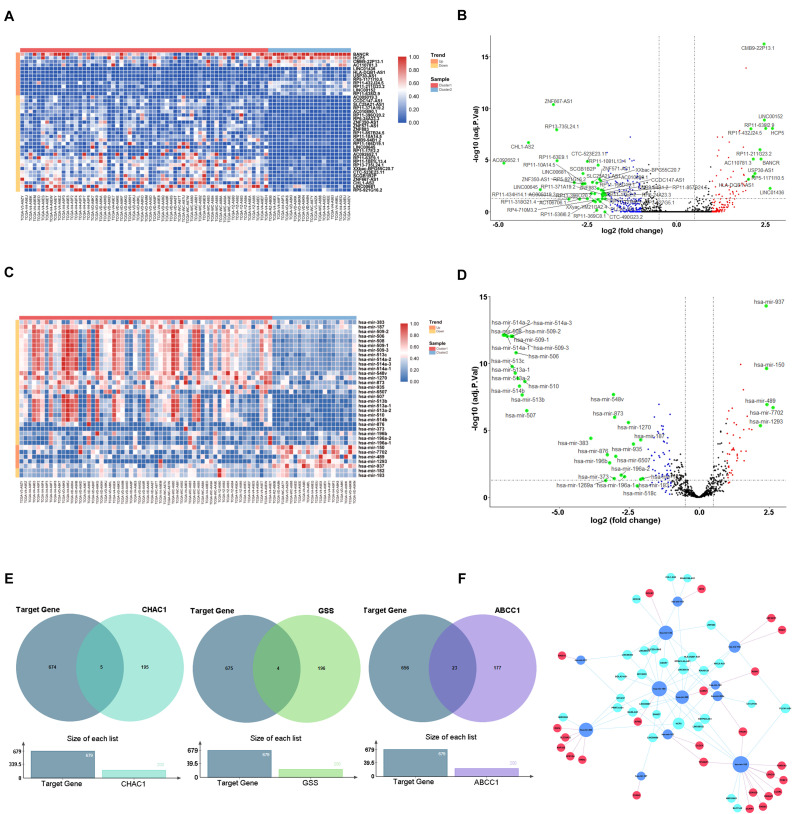
FIGURE 7.
Construction of ceRNA network key genes. (A) Heatmap of differential expression lncRNAs. (B) Volcano plot of differential expression lncRNAs. (C) Heatmap of differential expression miRNAs. (D) Volcano plot of differential expression miRNAs. (E) Venn plot of target mRNAs and highly associated ferroptosis-related regulators. (F) ceRNA building of the 29 lncRNAs (light blue) and 12 miRNAs (dark blue) and 25 mRNAs (red).

