Fig. 6.
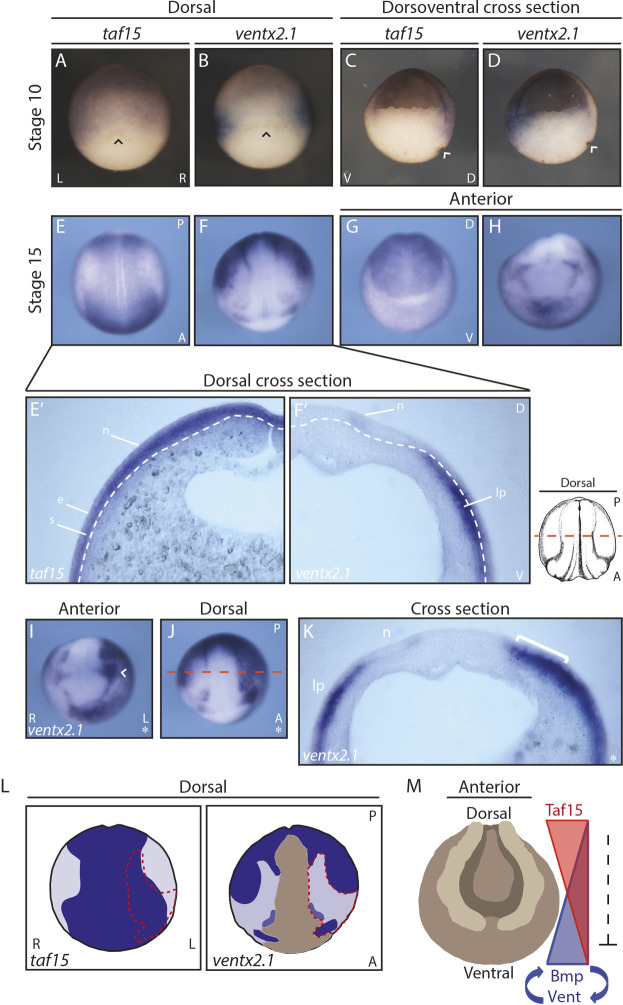
taf15 and ventx2.1 exhibit complementary expression patterns and Taf15 depletion leads to expansion of ventx2.1 expression into the neuroectoderm. (A,C,E,E′,G) Whole-mount ISH of taf15. (B,D,F,F′,H,I,J,K) Whole-mount ISH of ventx2.1. Black and white arrowheads in A,B, and C,D, respectively, indicate the dorsal lip. Dashed-white lines indicate the boundaries between the neural ectoderm and lateral plate mesoderm; dashed orange line indicates the site of the cross-sections. Asterisks indicate the injected side. White arrowhead in I indicates the eye anlage. White bracket in K indicates expanded ventx2.1 expression. (L) Schematic comparing taf15 and ventx2.1 expression. Dark blue indicates stronger expression and light purple indicates weaker expression; dashed-red line indicates the region of ventx2.1 expansion; brown indicates background level expression. (M) Model of Taf15 repression in the ventrolateral Bmp/Vent circuit. Representative images of more than 12 embryos in A-H,I,J, and more than five cross-sectioned embryos in E′,F′,K. All injections for downstream RNA ISH were into one cell of two-cell-stage embryos in I,J,K; the uninjected cell served as an internal control. A, anterior; D, dorsal; e, epithelial layer of the epidermal ectoderm; L, left; lp, lateral plate mesoderm; n, neural ectoderm; P, posterior; R, right; s, sensorial layer of the epidermal ectoderm; V, ventral.

