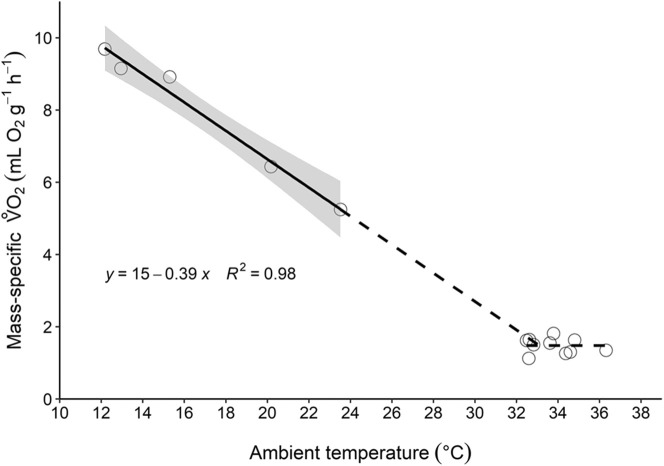
Fig. 1.
The thermoregulatory curve obtained for M. mystacinus. The metabolic rate is given as mass-specific  (ml O2 g−1 h−1) as a function of ambient temperature (°C). Each circle represents one
  measurement (Nindividuals=7, Nmeasurements=15). The solid line represents the linear regression for resting metabolic rate, with the equation y=14.51–0.39x (f1,3=162, P=0.001, Table S1). The grey area shows the 95% confidence interval for the regression line. The decreasing dashed line is an extrapolation of the linear regression, whereas the horizontal dashed line is a visual representation of the mean BMR.

