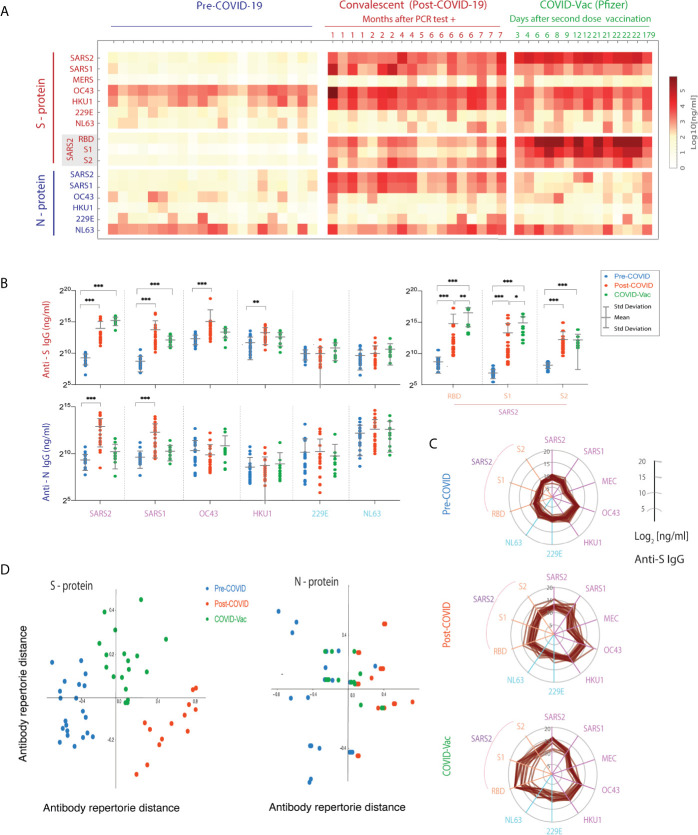
Figure 5.
Spike (S)- and nucleocapsid (N)-reactive IgG antibody levels to human coronaviruses (HCoVs) in VAMS blood samples of pre-COVID, convalescents, and post-vaccination subjects. (A) The IgG concentrations (ng/mL) of each S and N-reactive IgG antibodies against HCoVs. The heatmap shows mean concentration (ng/ml) of duplicate samples. (B) Comparison of differences in range of anti-HCoV S- and N- protein IgG between pre-, post-COVID and post-vaccination cohorts. (***p < 0.001, **p < 0.01,*p < 0.05). (C) The broad cross-reactive anti-S IgG antibody concentrations of HCoVs in three cohorts shown in multivariate spider plots, with each axis representing log2 IgG concentrations. (D) Multidimensional Scaling (MDS) analysis of the VAMS results.

