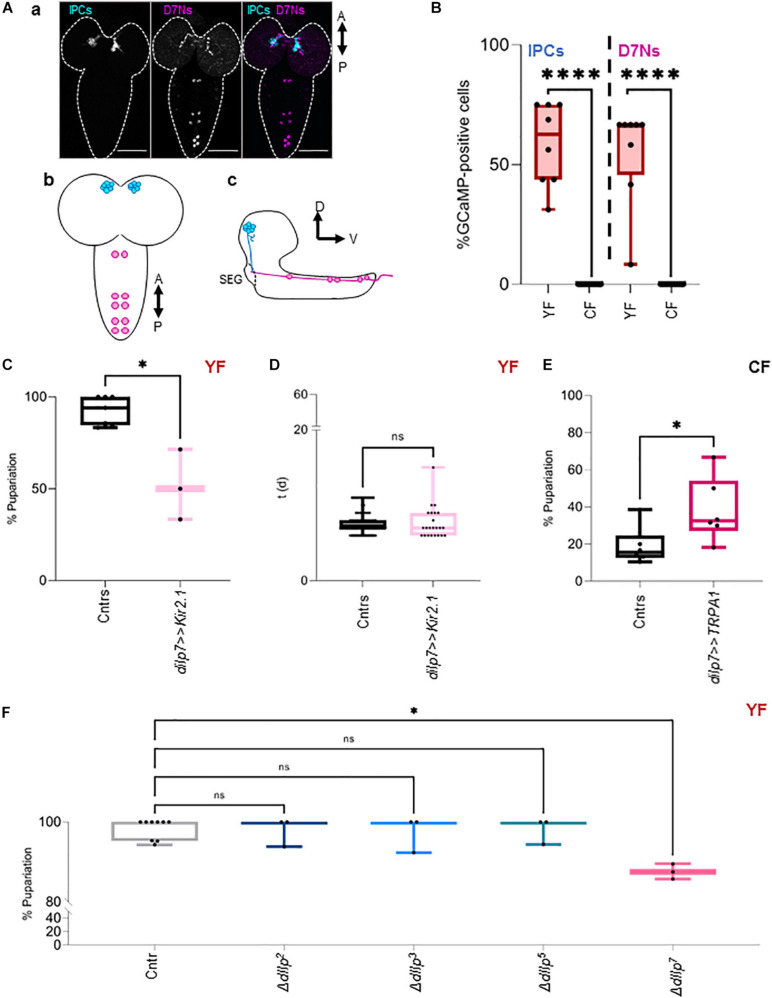
FIGURE 1.
DIlp7-producing neurons provide heat resistance. (A) Confocal Z-projection (a, scale bar = 50 μm) and graphical depictions (b,c) of larval brains. Shown are the relative position of Insulin-producing cells (IPCs, blue) and dIlp7-neurons (D7Ns, magenta). Crossed arrows point out relative view axis. (B) Fluorescent GCaMP neurons were counted in fixed brains from larvae kept on yeast food (YF, red box-plots) or corn food (CF, black box-plots) at 20°C. Shown are the percentage of activated cells for n brains (black dots). Significance calculated by Mann-Whitney’s test, p < 0.0001****. For crude data, see Supporting informations_Raw data_Main figures/Supplementary Figure 1B (C,D) Plotted are the percentage of formed pupae (C) or the time (in days, d) to reach pupariation (D) of individual larvae kept on yeast food (YF). Compared are genetic controls (Cntrs; pooled data of dilp7-Gal4/+ and UAS-Kir2.1/+) and larvae expressing Kir2.1 in D7Ns (dilp7 > > Kir2.1, light-pink) at 28°C. (C) Box plot, each black dot represents one experiment with minimum n = 6 individual larvae. Significance calculated by Mann-Whitney’s test, p = 0.0167∗. For crude data, see Supporting informations_Raw data_Main figures/Supplementary Figure 1C. (D) Box-plot, each black dot represents one larva. Significance calculated by Kruskal-Wallis test, p = 0.7457ns. For crude data, see Supporting informations_Raw data_Main figures/Supplementary Figure 1D. (E) Plotted are the percentage of formed pupae of genetic controls (Cntrs; pooled data of dilp7-Gal4/+ and UAS-TRPA1/+) and larvae expressing TRPA1 in D7Ns (dilp7 > > TRPA1, dark-pink) kept on corn food (CF) at 28°C. Box-plot, each black dot represents one experiment with minimum n = 6 individual larvae. Significance calculated by Mann-Whitney’s test, p = 0.0411∗. For crude data, see Supporting informations_Raw data_Main figures/Supplementary Figure 1E. (F) Shown is the developmental success on yeast food (YF) at 28°C. Plotted are the percentage of formed pupae of genetic controls (mCherry:FOXO, Cntr) and different dIlp mutants as indicated on the X-axis. Box plot, each dot represents one experiment with minimum n = 6 individual larvae. Statistics, Kruskal-Wallis test, p > 0.9999ns; p = 0.0141∗. For crude data, see Supporting informations_Raw data_Main figures/Supplementary Figure 1F.

