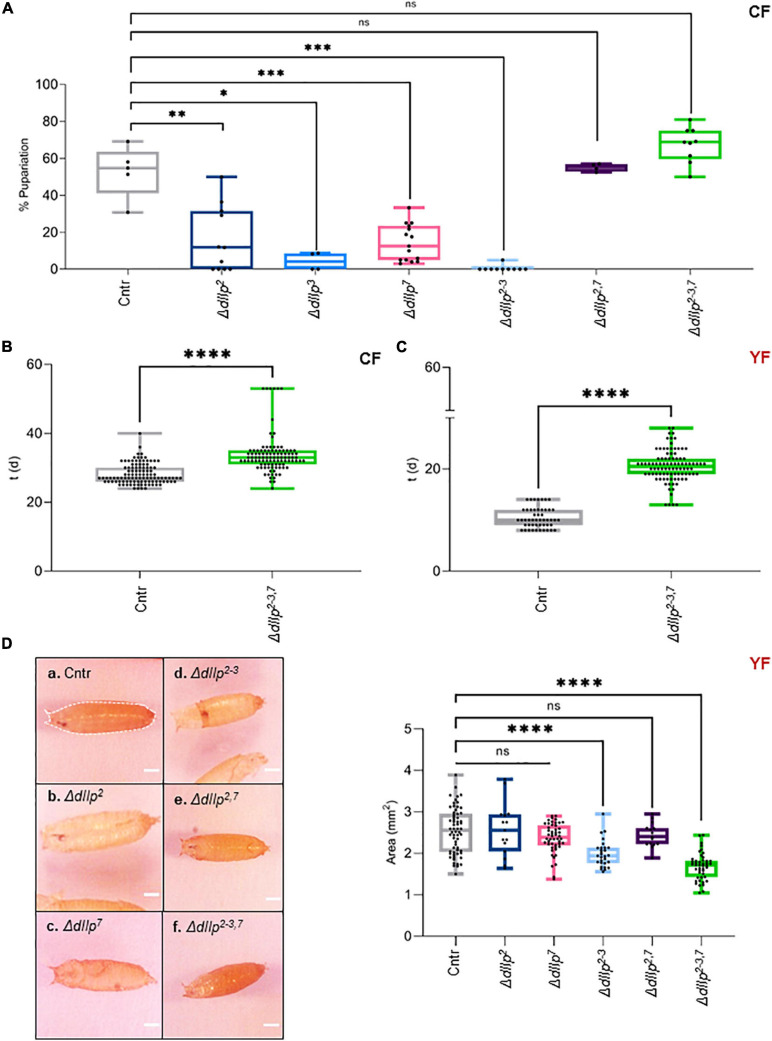
FIGURE 2.
DIlp7 regulates larval development on yeast-free corn food. (A) Plotted is the larval survival on corn food (CF) at 20°C. Shown are the percentage of formed pupae from genetic controls (mCherry:FOXO, Cntr) and different dIlp mutants as indicated on the X-axis. Box-plot, each dot represents one experiment with minimum n = 10 individual larvae. Significance calculated by Mann-Whitney’s test, Cntr vs. ΔdIlp2: p = 0.0025∗∗; Cntr vs. ΔdIlp3: p = 0.0159∗; Cntr vs. ΔdIlp7: p = 0.0002∗∗∗; Cntr vs. ΔdIlp2–3: p = 0.0003∗∗∗; Cntr vs. ΔdIlp2,7: p > 0.9999ns; Cntr vs. ΔdIlp2–3,7: p = 0.0889ns. For crude data, see Supporting informations_Raw data_Main figures/Supplementary Figure 2A. (B,C) Shown as box-plots are the larval developmental speed (in days, d) on corn food (CF, B) or yeast food (YF, C) at 20°C. Compared are genetic controls (mCherry:FOXO, Cntr) with ΔdIlp2–3,7 triple mutants. For crude data, see Supporting informations_Raw data_Main figures/Supplementary Figures 2B,C. Significance calculated by Mann-Whitney’s test, p < 0.0001****. (D) Shown are photographs (a–f) of pupae formed from larvae kept on yeast food (YF) at 20°C. Pupal areas (indicated in a., broken line) of genetic controls (mCherry:FOXO, Cntr) and different dIlp mutants were measured and plotted on a box-plot (one black dot = one pupa). Significance calculated by Mann-Whitney’s test, Cntr vs. ΔdIlp2: p = 0.9366ns; Cntr vs. ΔdIlp7: p = 0.1017ns; Cntr vs. ΔdIlp2–3, ΔdIlp2–3,7: p < 0.0001****; Cntr vs. ΔdIlp2,7: p = 0.5218ns. For crude data, see Supporting informations_Raw data_Main figures/Supplementary Figure 2D.

