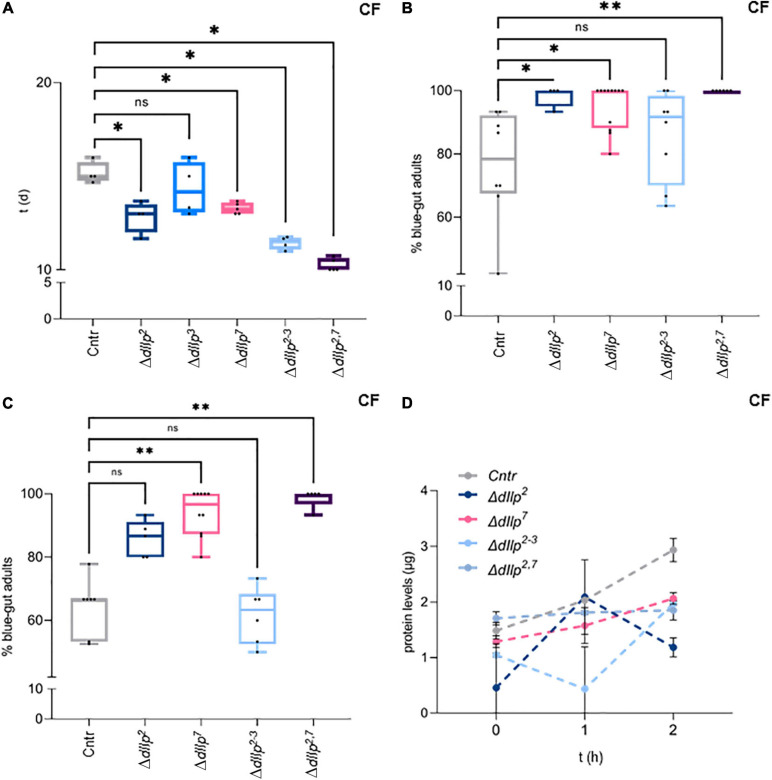
FIGURE 3.
DIlp7 regulates food intake, transition and absorption of adult flies kept on yeast-free food. (A) Shown are box-plots depicting survival rates of staged adult flies transferred onto yeast-free corn food (CF) at 25°C. Plotted is time (in days, d) to reach 50% lethality for genetic controls (mCherry:FOXO, Cntr) and different dIlp mutants as indicated. One black dot = one experiment. Significance calculated by Mann-Whitney’s test, Cntr vs. ΔdIlp2, ΔdIlp2–3: p = 0.0286∗; Cntr vs. ΔdIlp3: p = 0.5714ns; Cntr vs. ΔdIlp7, ΔdIlp2,7: p = 0.0159∗. For crude data, see Supporting informations_Raw data_Main figures/Supplementary Figure 3A. (B,C) Plotted are the percentage of adult females kept on dye-containing corn food (CF) with colored abdomens after 4 h (B), and colored-abdomen flies transferred onto dye-less corn food (CF) with colored abdomens after 4 h (C) at 20°C. The data for genetic controls (mCherry:FOXO, Cntr) and different dIlp mutants are depicted as box plots; one black dot = one experiment. (B) Significance calculated by Kruskal-Wallis test, Cntr vs. ΔdIlp2: p = 0.0282∗; Cntr vs. ΔdIlp7: p = 0.0132∗; Cntr vs. ΔdIlp2–3: p > 0.9999ns; Cntr vs. ΔdIlp2,7: p = 0.013∗∗. For crude data, see Supporting informations_Raw data_Main figures/Supplementary Figure 3B. (C) Significance calculated by Kruskal-Wallis test, Cntr vs. ΔdIlp2: p = 0.2396ns; Cntr vs. ΔdIlp7: p = 0.0016∗∗; Cntr vs. ΔdIlp2–3: p > 0.9999ns; Cntr vs. ΔdIlp2,7: p = 0.0012∗∗. For crude data, see Supporting informations_Raw data_Main figures/Supplementary Figure 3C. (D) Starved flies were transferred onto plates loaded with protein baits at 20°C and hemolymph was taken after set time intervals (in hours, h; 0, 1, and 2 h). Plotted are measured hemolymph protein levels of genetic controls (mCherry:FOXO, Cntr) and different dIlp mutants as indicated. Error bars represent standard deviation; plotted are the mean. Significances calculated by Dunnett’s multiple comparison test but not shown to avoid overloaded graph, 0 h: Cntr vs. ΔdIlp2: p = 0.072∗∗; Cntr vs. ΔdIlp7: p = 0.9132ns; Cntr vs. ΔdIlp2–3: p = 0.4179ns; Cntr vs. ΔdIlp2,7: p = 0.8744ns. 1 h: Cntr vs. ΔdIlp2: p = 0.9990ns; Cntr vs. ΔdIlp7: p = 0.4465 ns; Cntr vs. ΔdIlp2–3: p = 0.0002∗∗∗; Cntr vs. ΔdIlp2,7: p = 0.8939ns. 2 h: Cntr vs. ΔdIlp2: p < 0.0001****; Cntr vs. ΔdIlp7: p = 0.0260∗; Cntr vs. ΔdIlp2–3: p = 0.0285∗; Cntr vs. ΔdIlp2,7: p = 0.047∗∗. For crude data, see Supporting informations_Raw data_Main figures/Supplementary Figure 3D.

