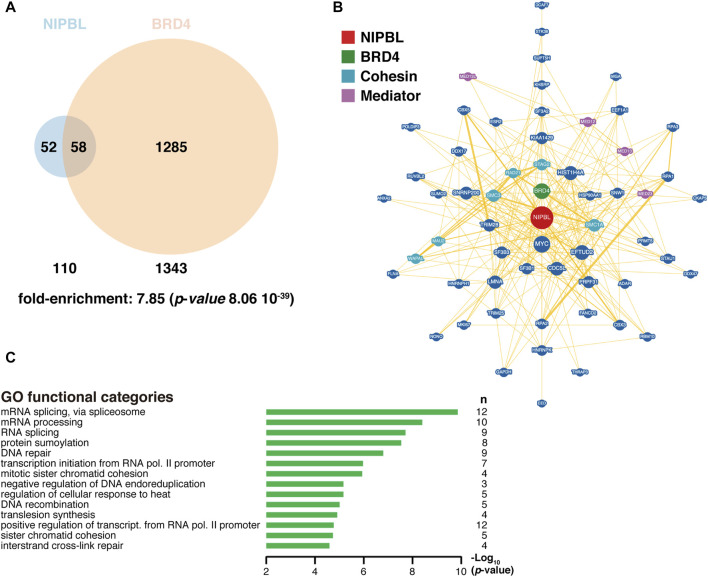
FIGURE 3.
NIPBL and BRD4 interactome. (A) Venn diagram indicating the overlap of NIPBL and BRD4 interactors. Fold-enrichment of common interactors and its associated p-value from the hypergeometric distribution was obtained at (https://systems.crump.ucla.edu/hypergeometric/index.php), assuming a total proteome of at least 100,000 different proteins. Data were obtained from BioGRID (https://wiki.thebiogrid.org/doku.php/tools). Venn diagrams were constructed with the Venny 2.1 tool (https://bioinfogp.cnb.csic.es/tools/venny/) and depicted with Venn Diagram Maker at (https://www.meta-chart.com/venn). (B) Common NIPBL-BRD4 interactome with NIPBL occupying a central position (red). BRD4 is indicated in green, Mediator proteins in purple and cohesin-related proteins in light blue. Data and representation were derived from BioGRID. (C) Gene Ontology (GO) analysis of common interactors was performed with the DAVID tool at (https://david.ncifcrf.gov/tools.jsp). n, number of genes in each category.

