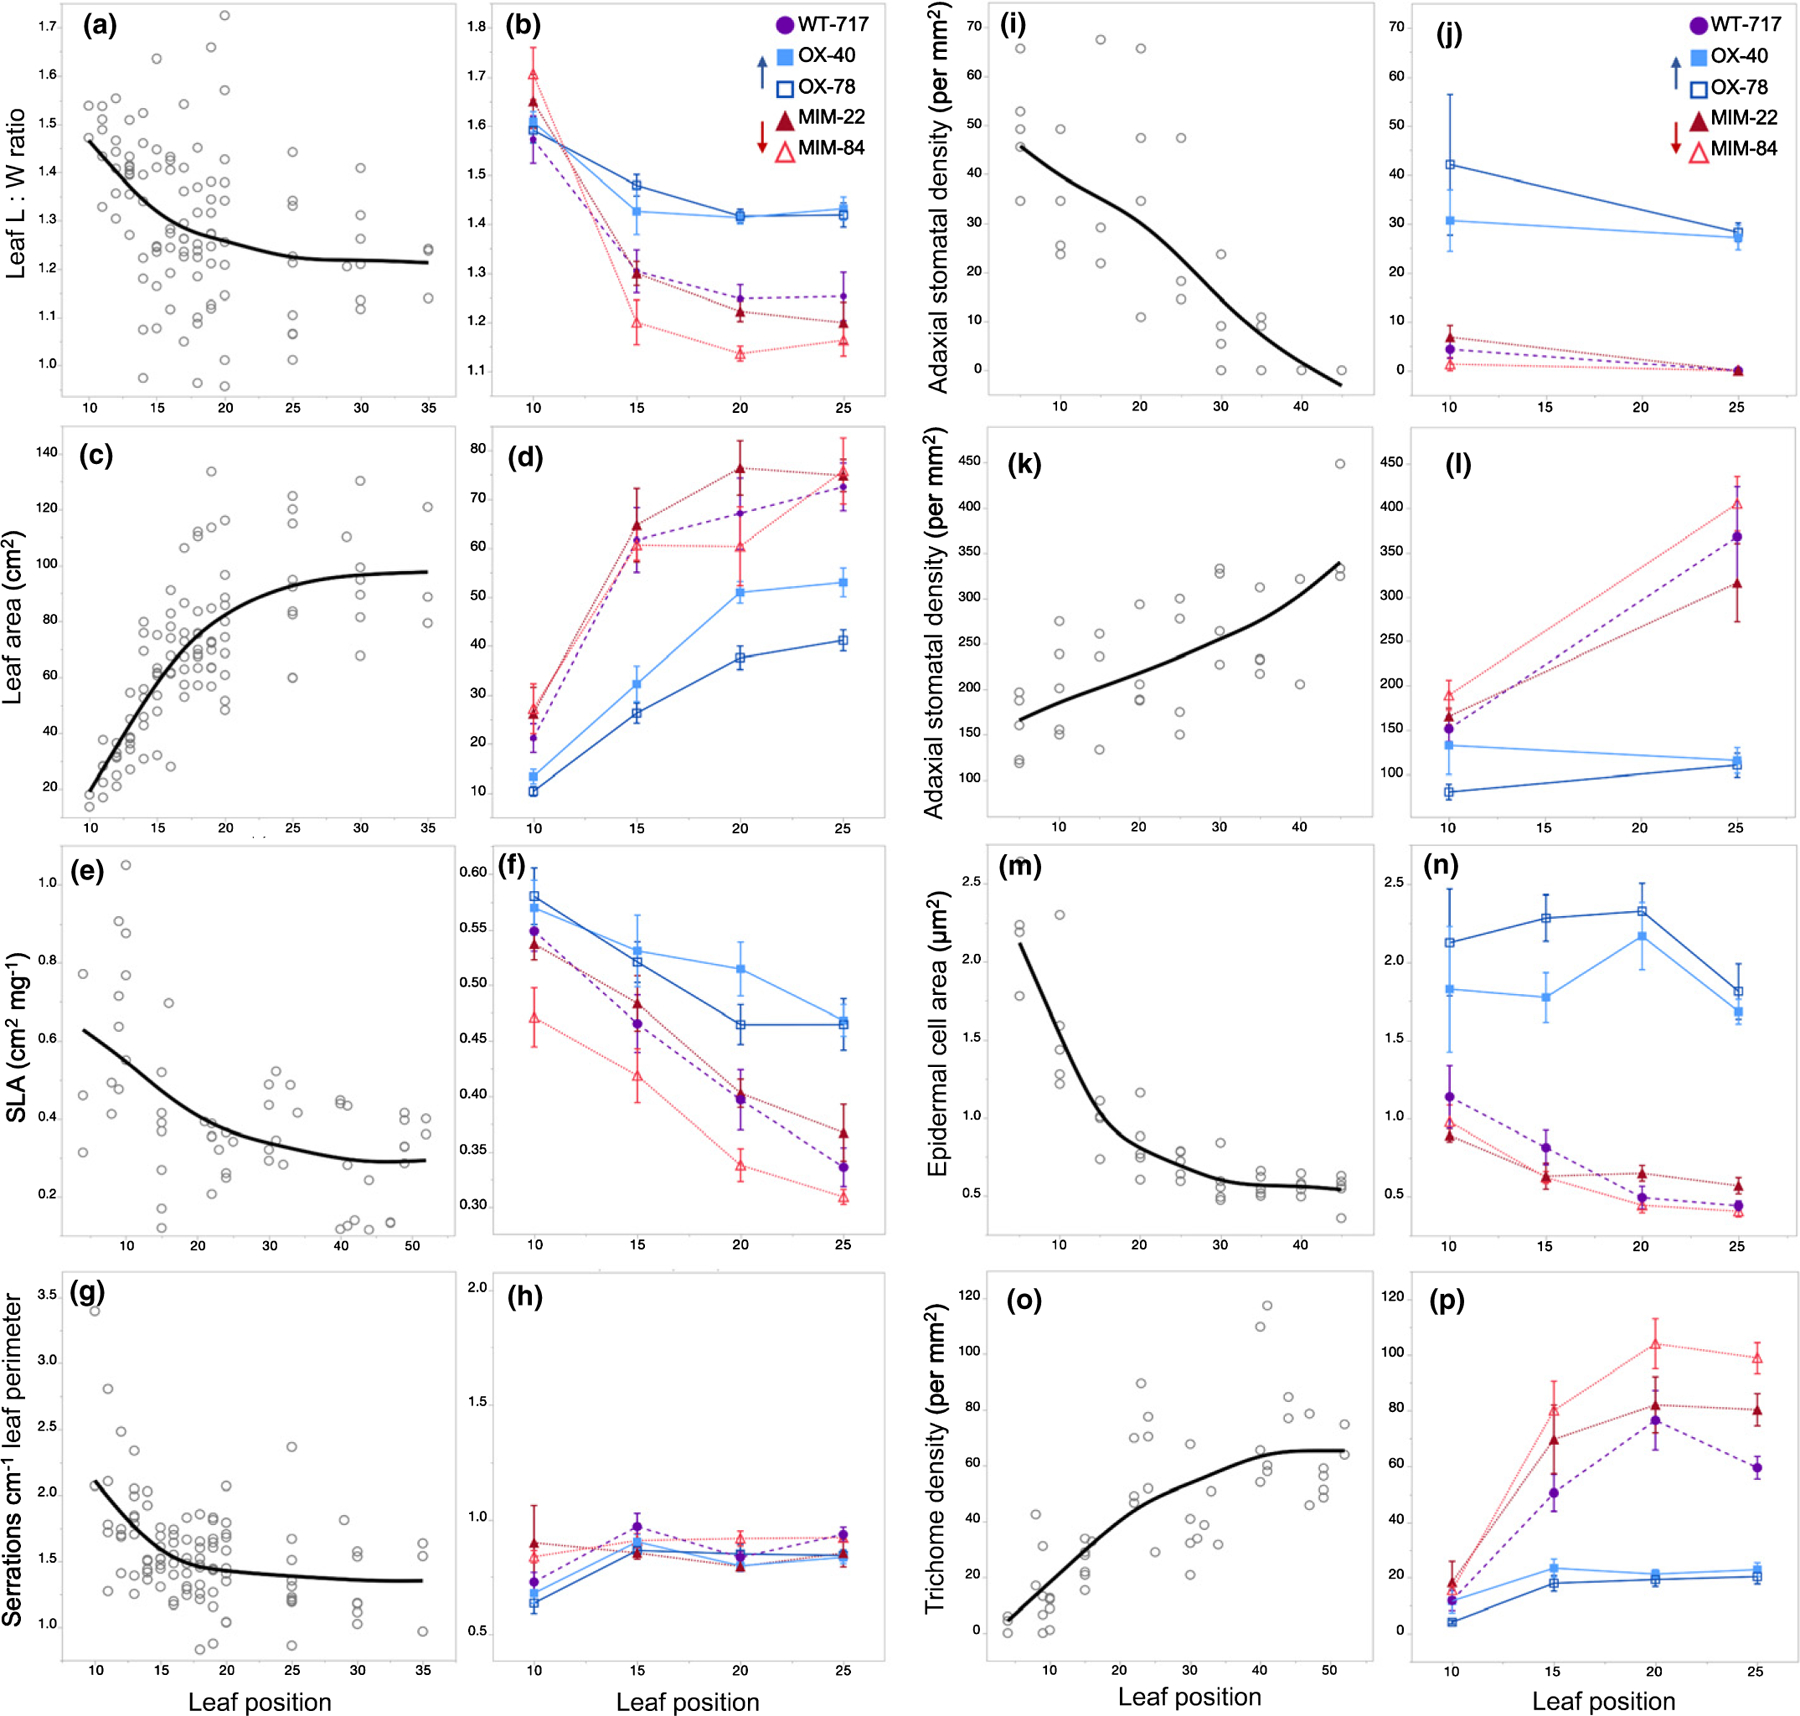
Fig. 4.

Leaf length : width (L : W) ratio, leaf area, specific leaf area (SLA), serrations per centimeter of leaf perimeter, adaxial stomatal density, abaxial stomatal density, adaxial epidermal cell area and abaxial trichome density of seed-grown P. tremula × alba (a, c, e, g, i, k, m, o) and the 717–1B4 and transgenic lines (b, d, f, h, j, l, n, p). Data from seed-grown plants presented as individual biological replicates using grey open circles and a mean best-fit line in black or as means ± SE with 717 wild-type data depicted by purple circles, miR156a overexpression lines depicted by blue squares and MIM156 lines depicted by red triangles (n = 5–11). Data in (a), (c), (e), (g), (m) and (o) show a second-degree polynomial relationship with P < 0.0001 and R2 values of 0.17, 0.6, 0.32, 0.25, 0.85 and 0.56, respectively. Data in (i) and (k) show a linear relationship with P < 0.0001 and R2 values of 0.58 and 0.46 respectively. ANCOVAs with leaf position and genotype as the effects for data in (b), (d), (f), (l), (n) and (p) found P < 0.001 for both leaf position and genotype. In (j), P < 0.001 for genotype but not significant (ns) for leaf position. In (h), P < 0.01 for leaf position but ns for genotype. For the interaction between genotype and leaf position, P < 0.05 for data in (b), (f), (l), and (p) and ns for (d), (h), (j) and (n).
