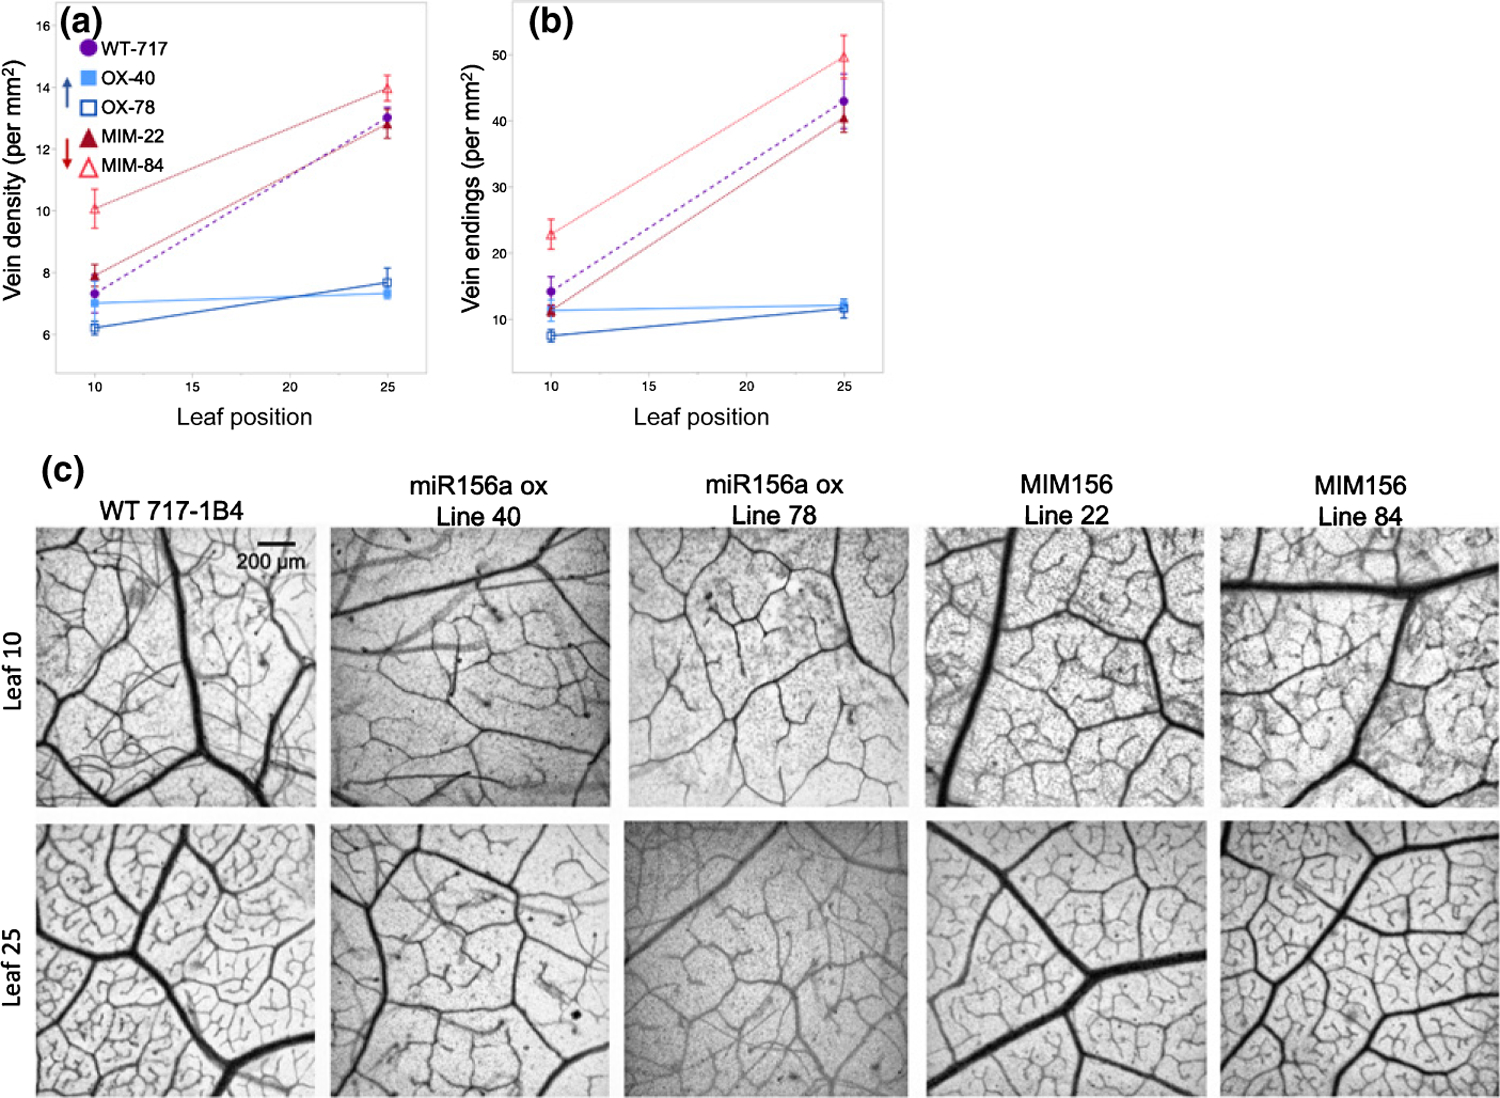
Fig. 6.

Total leaf vein density (a) and the number of vein endings (b) in the 717–1B4 and transgenic Populus tremula × alba. Data from seed-grown plants presented as individual biological replicates using grey open circles and a mean best-fit line in black or as means ± SE with 717 wild-type data depicted by purple circles, miR156a overexpression lines depicted by blue squares and MIM156 lines depicted by red triangles (n = 5–6). ANCOVA with leaf position and genotype as the effects found P < 0.0001 for both effects and the interaction for data in (a) and (b). Representative samples of leaves cleared and stained to visualized vein density and architecture in leaves 10 and 25 of 717–1B4 and transgenic poplar lines (c).
