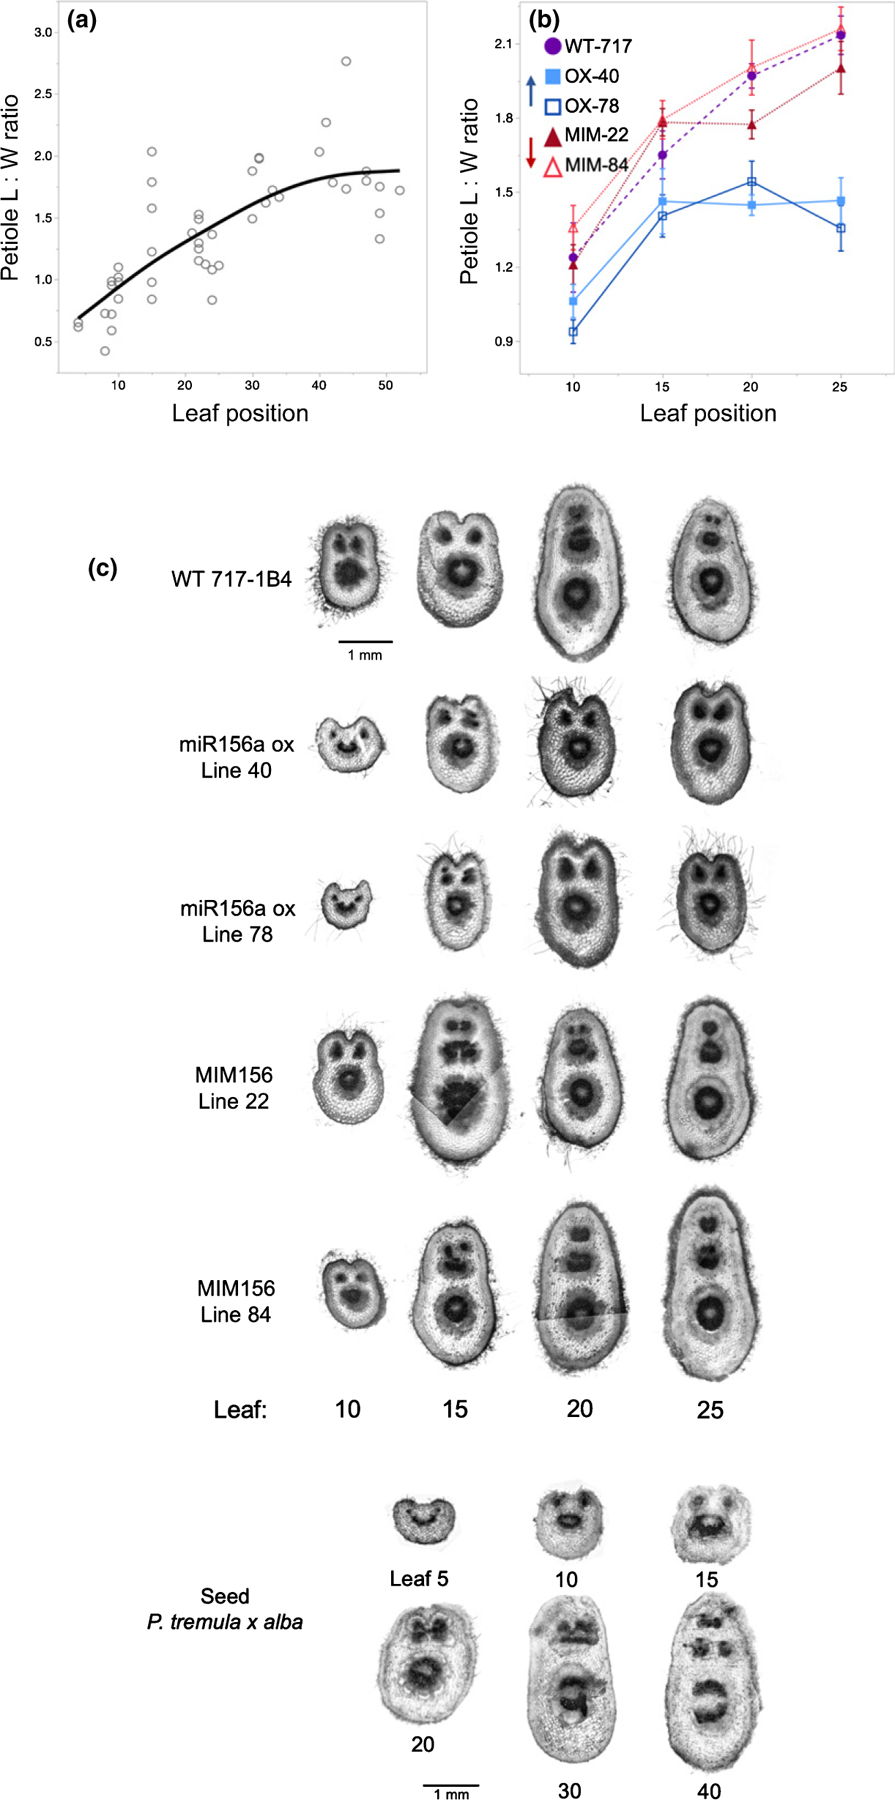
Fig. 7.

Petiole length : width (L : W) ratio from cross-sections made within 1 cm of leaf attachment in seed-grown (a) and 717–1B4 and transgenic Populus tremula × alba (b). Data from seed-grown plants presented as individual biological replicates using grey open circles and a mean best-fit line in black or as means ± SE with 717 wild-type data depicted by purple circles, miR156a overexpression lines depicted by blue squares and MIM156 lines depicted by red triangles (n = 7–12). Data from (a) show a second-degree polynomial relationship with P < 0.0001 and R2 = 0.62. For (b), ANCOVA with leaf position and genotype as the effects found P < 0.0001 for leaf position and genotype and P = 0.01 for the interaction. Representative samples of petiole cross-sections from leaves 10, 15, 20 and 25 of the 717–1B4 and four transgenic lines (c). Representative samples of petiole cross-sections from leaf positions between 5 and 40 in plants grown from seed (d).
