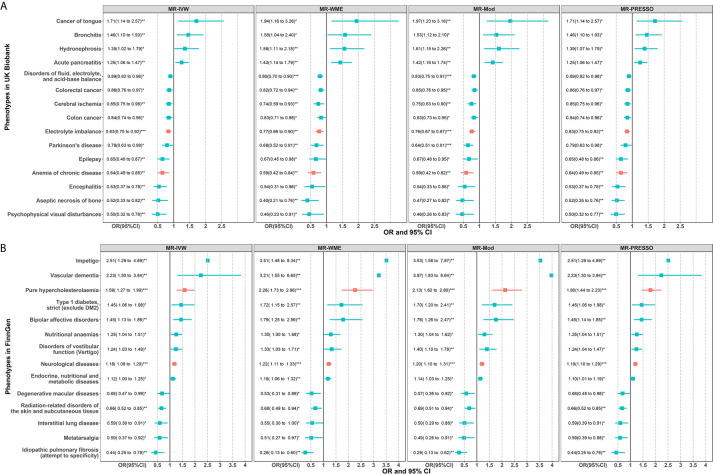
Figure 4.
Two-sample MR sensitivity analysis for significant phenotypes of MR-PheWAS in the UK Biobank (A) and FinnGen population (B). Only significant results in all of the four MR analyses are shown. The red error bars represent the phenotypes that also passed the FDR correction in the initial PheWAS analysis as shown in Figure 2. *P < 0.05; **P < 0.01; ***P < 0.001.

