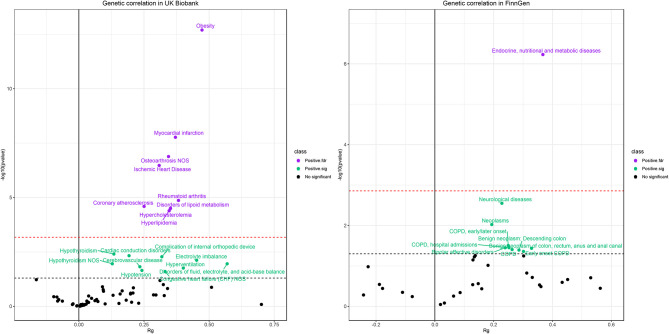
Figure 6.
Results of genetic correlation analysis in the UK Biobank population (left) and FinnGen population (right). The red dash line represents the FDR threshold (q < 0.05) and the blue dash line represent the experiential significant threshold (P < 0.05). The horizontal axis represents the genetic correlation coefficients (range −1 to 1) and the vertical axis represents –log10(P) values that means higher points indicate smaller P-values.

