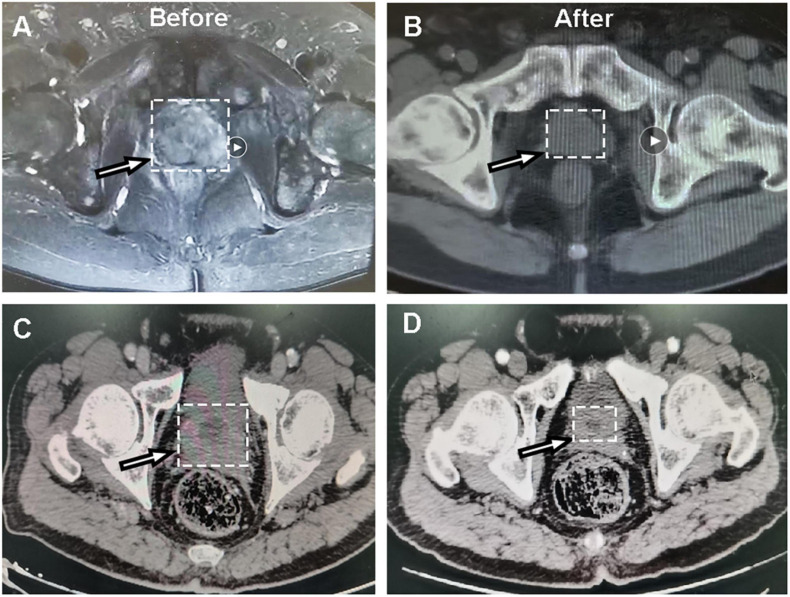
FIGURE 1.
Representative CT images of dicycloplatin-sensitive patients. (A,B) CT images of one patient with complete response taken before (A) and after (B) dicycloplatin treatment. (C,D) CT images of another patient with partial response taken before (C) and after (D) dicycloplatin treatment. White arrow represents the tumor localization.

