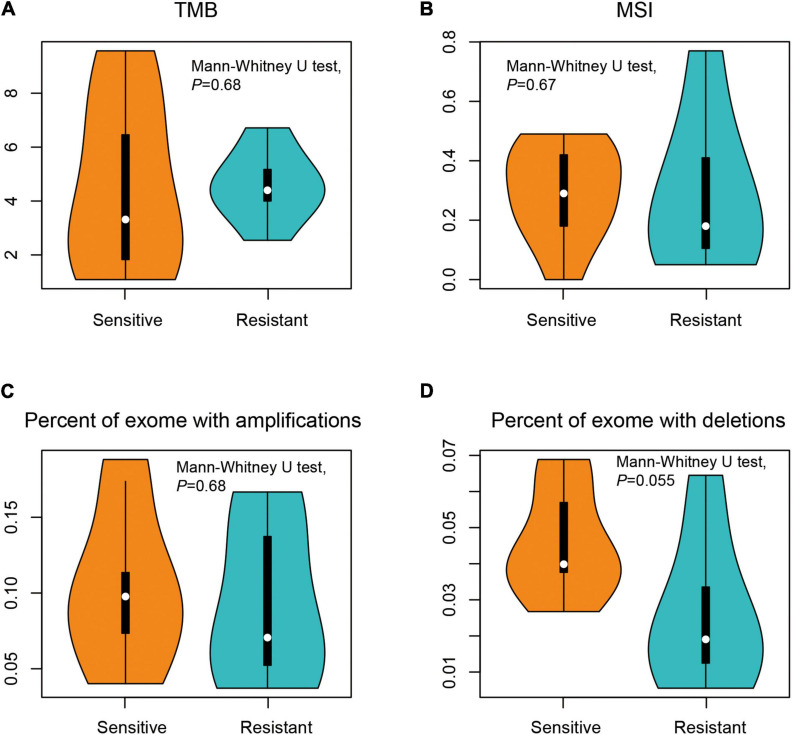
FIGURE 2.
Comparison of the genomic profiles between dicycloplatin-sensitive and dicycloplatin-resistant groups. (A) Tumor mutational burden (TMB). (B) Microsatellite instability (MSI) score. (C) Percentage of exons with amplification (defined as copy number ≥ 2 × average ploidy). (D) Percentage of exons with deletion (defined as copy number ≤ 0.5 × average ploidy).

