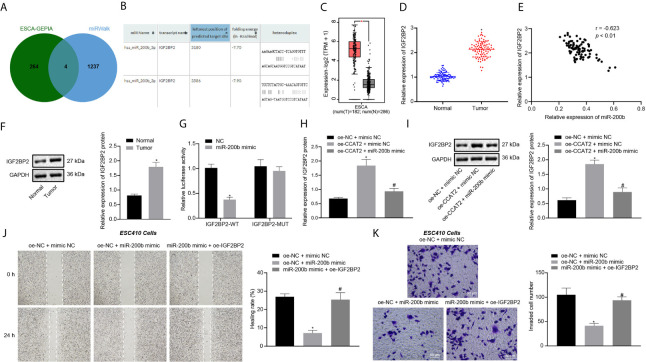
Figure 4.
CCAT2 upregulates the expression of IGF2BP2 by adsorbing miR-200b to promote the migration and invasion of ESCC cells. (A) Venn diagram of differentially expressed genes from GEPIA analysis and downstream genes of miR-200b obtained by miRWalk, and the intersection genes are CXCL8, LAMC2, IGF2BP2, and EPHB2. (B) The binding site between miR-200b and IGF2BP2 predicted by the RNA22 database. (C) The box diagram of IGF2BP2 expression through GEPIA analysis; the left red box indicates the expression in ESCC samples, and the right gray box indicates the expression in normal samples. (D) RT-qPCR detection of mRNA expression of IGF2BP2 in 93 cases of ESCC tissues and normal adjacent tissues. (E) Correlation analysis of IGF2BP2 mRNA expression and miR-200b expression in 93 cases of ESCC tissues by Pearson’s correlation analysis. (F) Immunoblotting analysis of IGF2BP2 protein in 93 cases of ESCC tissues and normal adjacent tissues. (G) Binding of miR-200b to IGF2BP2 confirmed by dual luciferase report assay. (H, I) RT-qPCR and immunoblotting detection of the mRNA and protein expression of IGF2BP2 in ESC410 cells after overexpression of CCAT2 and miR-200b. (J) Scratch assay detection of ESC410 cell migration ability in each group. (K) Transwell assay detection of ESC410 cell invasion ability in each group, scale bar = 50 μm. *p < 0.05 vs. normal adjacent tissues, HET-1A cell line, oe-NC-treated cells, sh-NC-treated cells, or oe-NC + mimic NC-treated cells. # p < 0.05 vs. oe-CCAT2 + mimic NC-treated cells or oe-NC + miR-200b mimic-treated cells. Data were shown as mean ± standard deviation of three technical replicates. Data between cancer tissues and normal adjacent tissues were compared by paired t-test. Data between remaining two groups were compared by unpaired t-test. Data among multiple groups were compared by one-way ANOVA with Tukey’s post hoc test.

