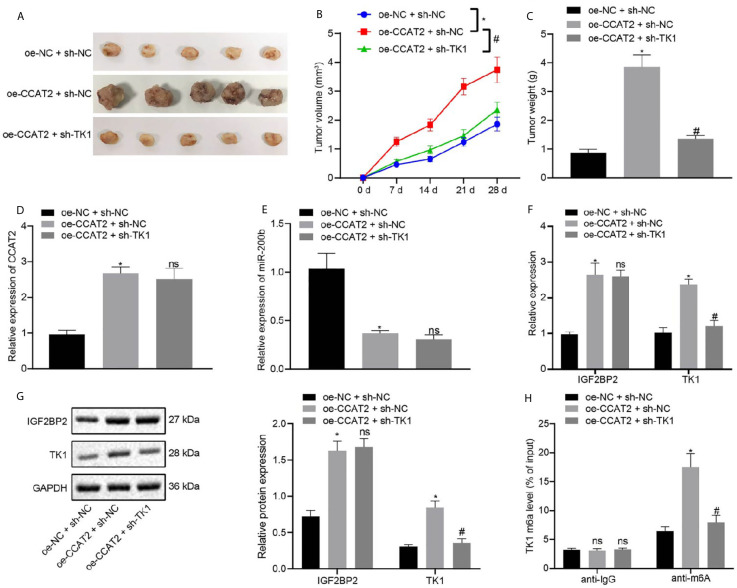
Figure 7.
CCAT2 upregulates the expression of TK1 to promote the tumorigenesis of ESCC cells in nude mice. (A) Representative images showing xenografts in nude mice of each group. (B) Changes in the volume of formed tumors within four weeks of implanting ESC410 cells transfected with different plasmids in each group. (C) The weight of formed tumors within four weeks of implanting ESC410 cells in each group. (D, E) RT-qPCR detection of the expression of CCAT2 and miR-200b in cancer tissues of oe-NC + sh-NC-treated mice, oe-CCAT2 + sh-NC-treated mice, and oe-CCAT2 + sh-TK1-treated mice. (F, G) RT-qPCR and immunoblotting detection of mRNA and protein expressions of IGF2BP2 and TK1 in cancer tissues of each group. (H) Me-RIP detection of the m6A modification level of TK1 in cancer tissues of each group. *p < 0.05 vs. oe-NC + sh-NC-treated mice. # p < 0.05 vs. oe-CCAT2 + sh-NC-treated mice. Data were shown as mean ± standard deviation of three technical replicates. Data among multiple groups were compared by one-way ANOVA with Tukey’s post hoc test. Comparison among groups at different time points was performed using repeated measures ANOVA with Bonferroni’s post hoc test. ns means no significant difference.

