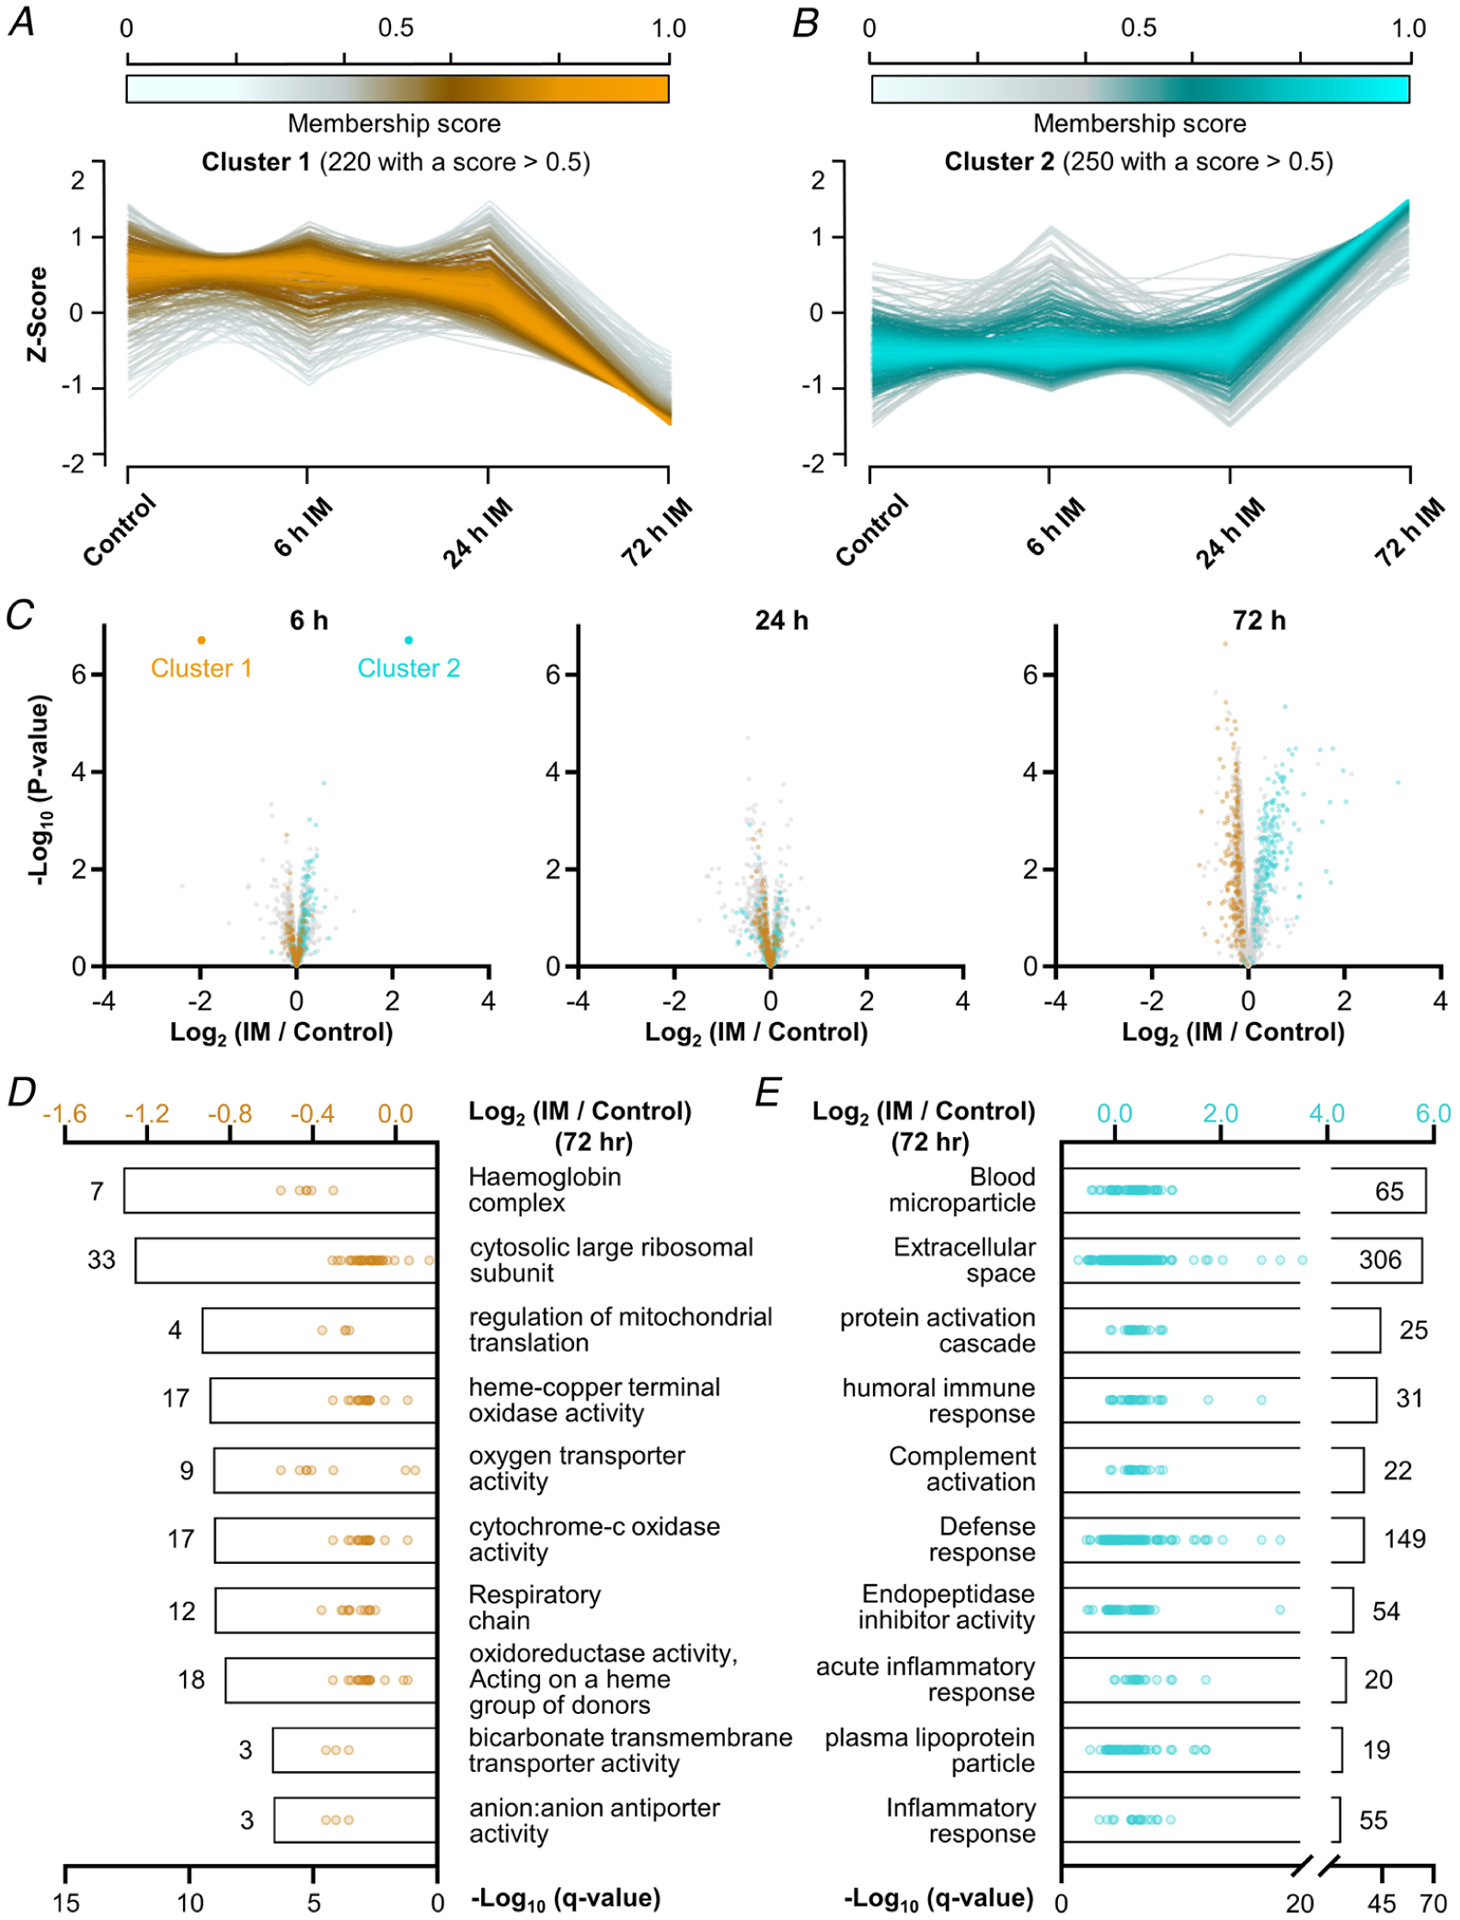
Figure 7. Temporal analysis of the changes in protein expression that occur after the onset of immobilization.

Soft clustering on Z-score normalized data proteomic data with Mfuzz led to the identification of four clusters (Figs 7 and 8). A and B, graphs showing the temporal pattern for the two largest clusters along with the associated membership score for each of the proteins in the cluster. C, volcano plots highlighting the position of cluster 1 (orange) and cluster 2 (cyan) proteins that possessed a membership score of > 0.5. Only data points with at least two valid values per group are shown in the plots. D and E, top 10 enriched GO terms in each cluster with the bars indicating the associated −log10 FDR-corrected P-value (i.e. q-value, bottom x-axis). The values indicate the number of proteins within each GO term, and the dots represent the log2 fold change of the individual proteins (top x-axis).
