
Figure 9. Immobilization leads to an increase in proteins that are involved in complement activation.
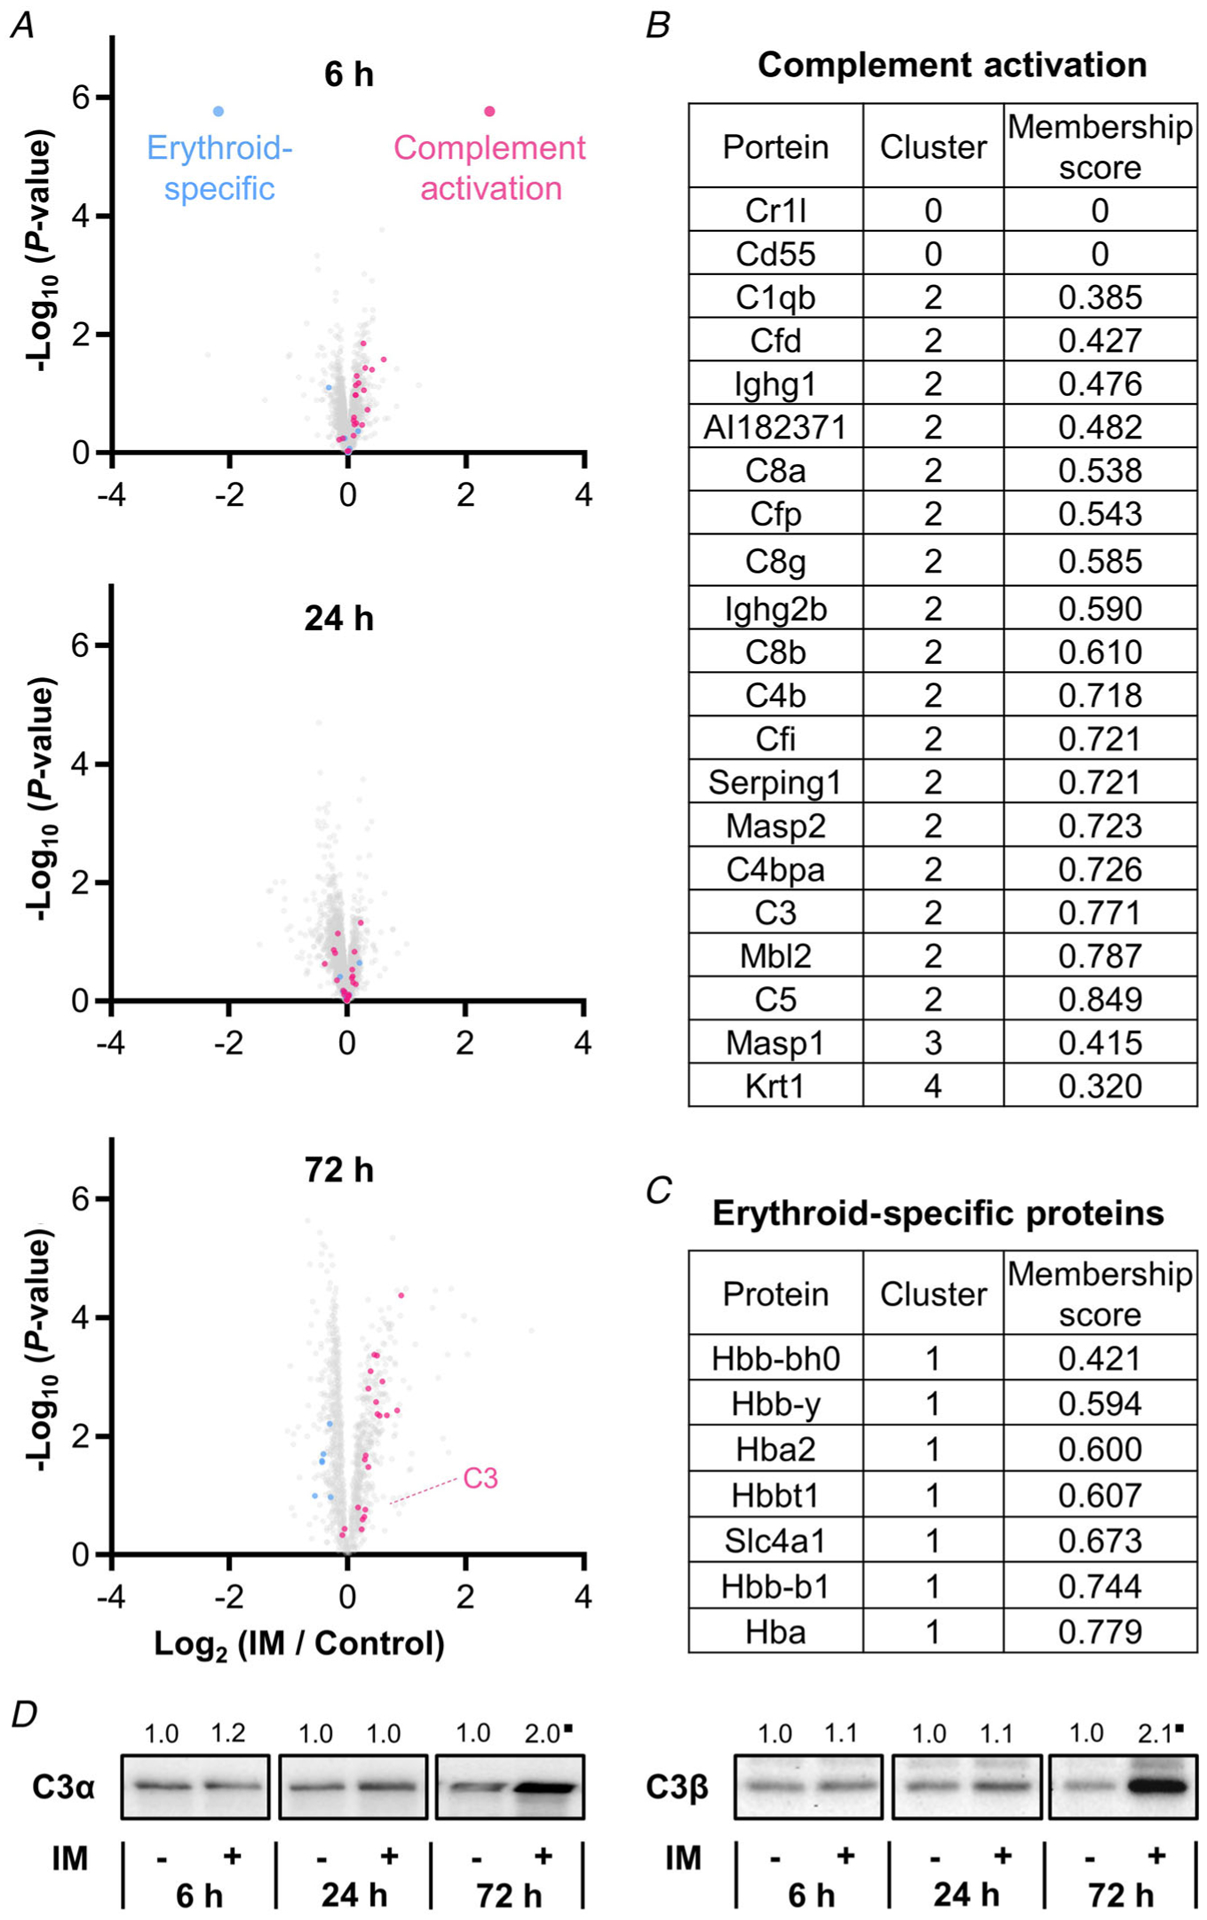
A, volcano plots highlighting the position of proteins that are annotated with the GO term ‘complement activation’ (pink) and ‘heme binding’ (blue). Only data points with at least two valid values per group are shown in the plots. B and C, list of all proteins annotated with the GO term ‘complement activation’ (B), and erythroid-specific proteins (C). D, representative western blots of complement component 3 (C3) α and β subunits. All values are group means expressed relative to the mean value obtained in the time-matched control samples; n = 5–7 per group. ∎Trend for significant difference from the time-matched control as determined by a pooled t test, P ≤ 0.09.