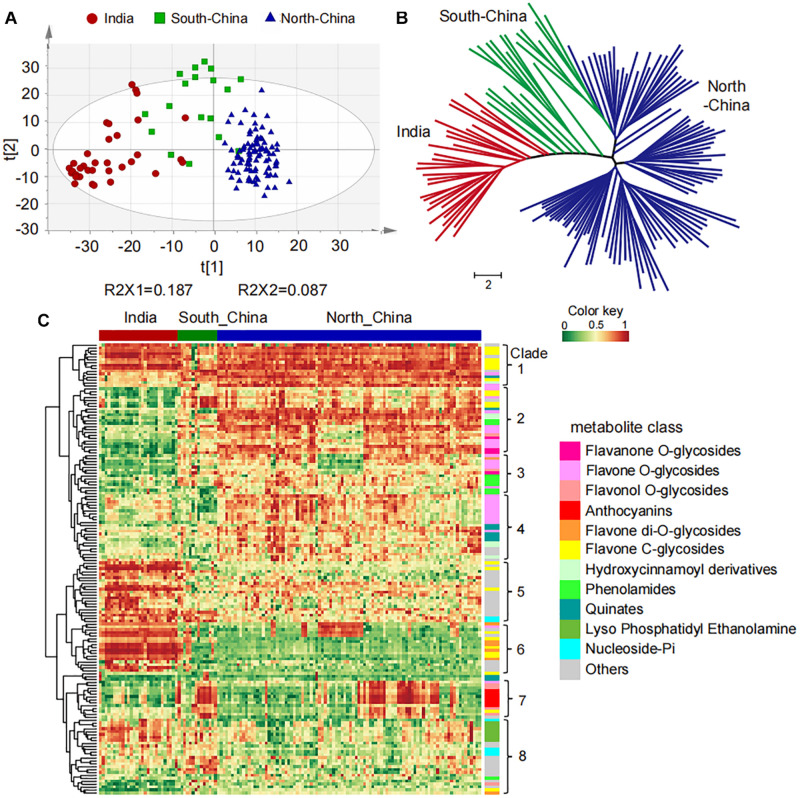
FIGURE 1.
Natural variation and population structure of 150 millet accessions based on metabolic profiling. (A) Score plot of principal component analysis (PCA) for datasets of millet leaf metabolites. The red, green, and blue dots represent samples from India, the south and north of China, respectively. (B) Neighbor-jointing phylogenetic tree of 150 millet accessions with leaf metabolites. Three major clades, represented by India (clade I), South-China (clade II), and North-China (clade III), were identified from the tree. The scale bar indicates the simple matching distance. (C) Heatmap visualization of relative differences of metabolites that showed significant differential accumulation among Indian and Chinese millet accessions. Each millet accession is visualized in a single column and each metabolite is represented by a single row. Data of the content value of each metabolite were normalized to complete linkage hierarchical clustering. Red indicates high abundance, and green indicates low relative metabolic contents.

