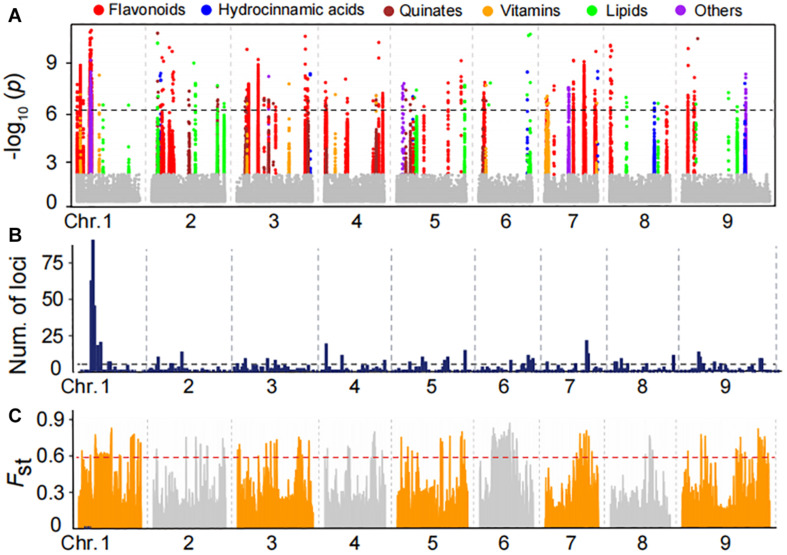
FIGURE 3.
Manhattan plots of mGWAS results and genetic differentiation of mGWAS loci between Indian and Chinese millet. (A) Manhattan plots of mGWAS results with the genetic association for the leaf metabolic features in millet. The strength of association for the metabolites is indicated as the negative logarithm of the p-value for the LMM model. All metabolite-SNP associations with P-values below 1.8E–06 are plotted against genome location in intervals of 1 Mb. (B) Distribution of mGWAS signals across the millet genome. (C) Distribution of differentiation (FST values) from the comparison of the Indian and northern Chinese millet populations. The regions above the dashed line in the FST values distribution are in the 5% right tail of the empirical distribution (FST is 0.59).

