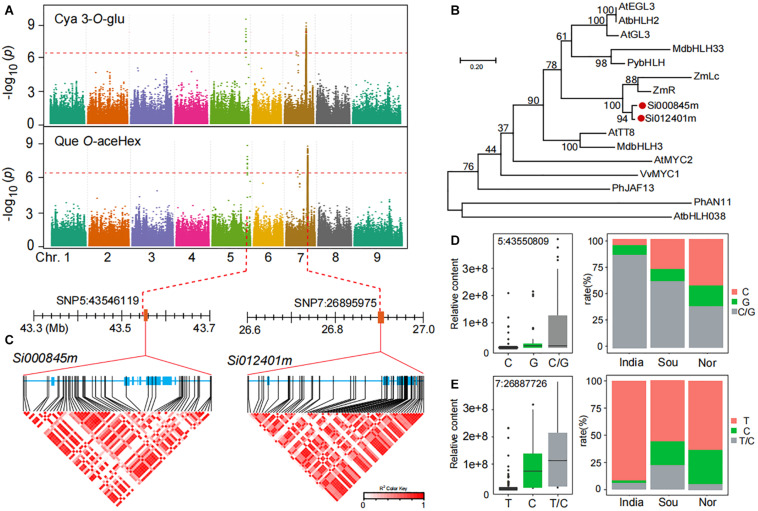
FIGURE 4.
Genome-wide association study of anthocyanins and flavonols in millet. (A) Manhattan plots of mGWAS results of cyanidin 3-O-glucoside (Cya 3-O-Glu) and quercetin O-acetylhexoside (Que O-aceHex) in millet. The strength of association for the metabolites is indicated as the negative logarithm of the p-value for the LMM model. All metabolite-SNP associations with p-values below 1.8E–06 are plotted against genome location in intervals of 1 Mb. (B) An unrooted phylogenetic tree of the MYC protein was constructed as described in Methods. Bootstrap values >70% (based on 1000 replications) are indicated at each node (bar: 0.2 amino acid substitutions per site). (C) A representation of pairwise r2 values (a measure of LD) among all polymorphic sites in Si000845m and Si012401m, where the color of each box corresponds to the r2 value according to the legend. (D,E) Natural variation of nucleotide polymorphisms identified in the sequences of Si000845m and Si012401m and their allelic frequencies in millet from India, south of China (Sou), and north of China (Nor).

