
Extended Data Fig. 8. Pairwise partial Spearman correlations between bacterial gene families and pathway abundances with clinical and metabolic risk scores, glycaemic and inflammatory measures, and lipoproteins.
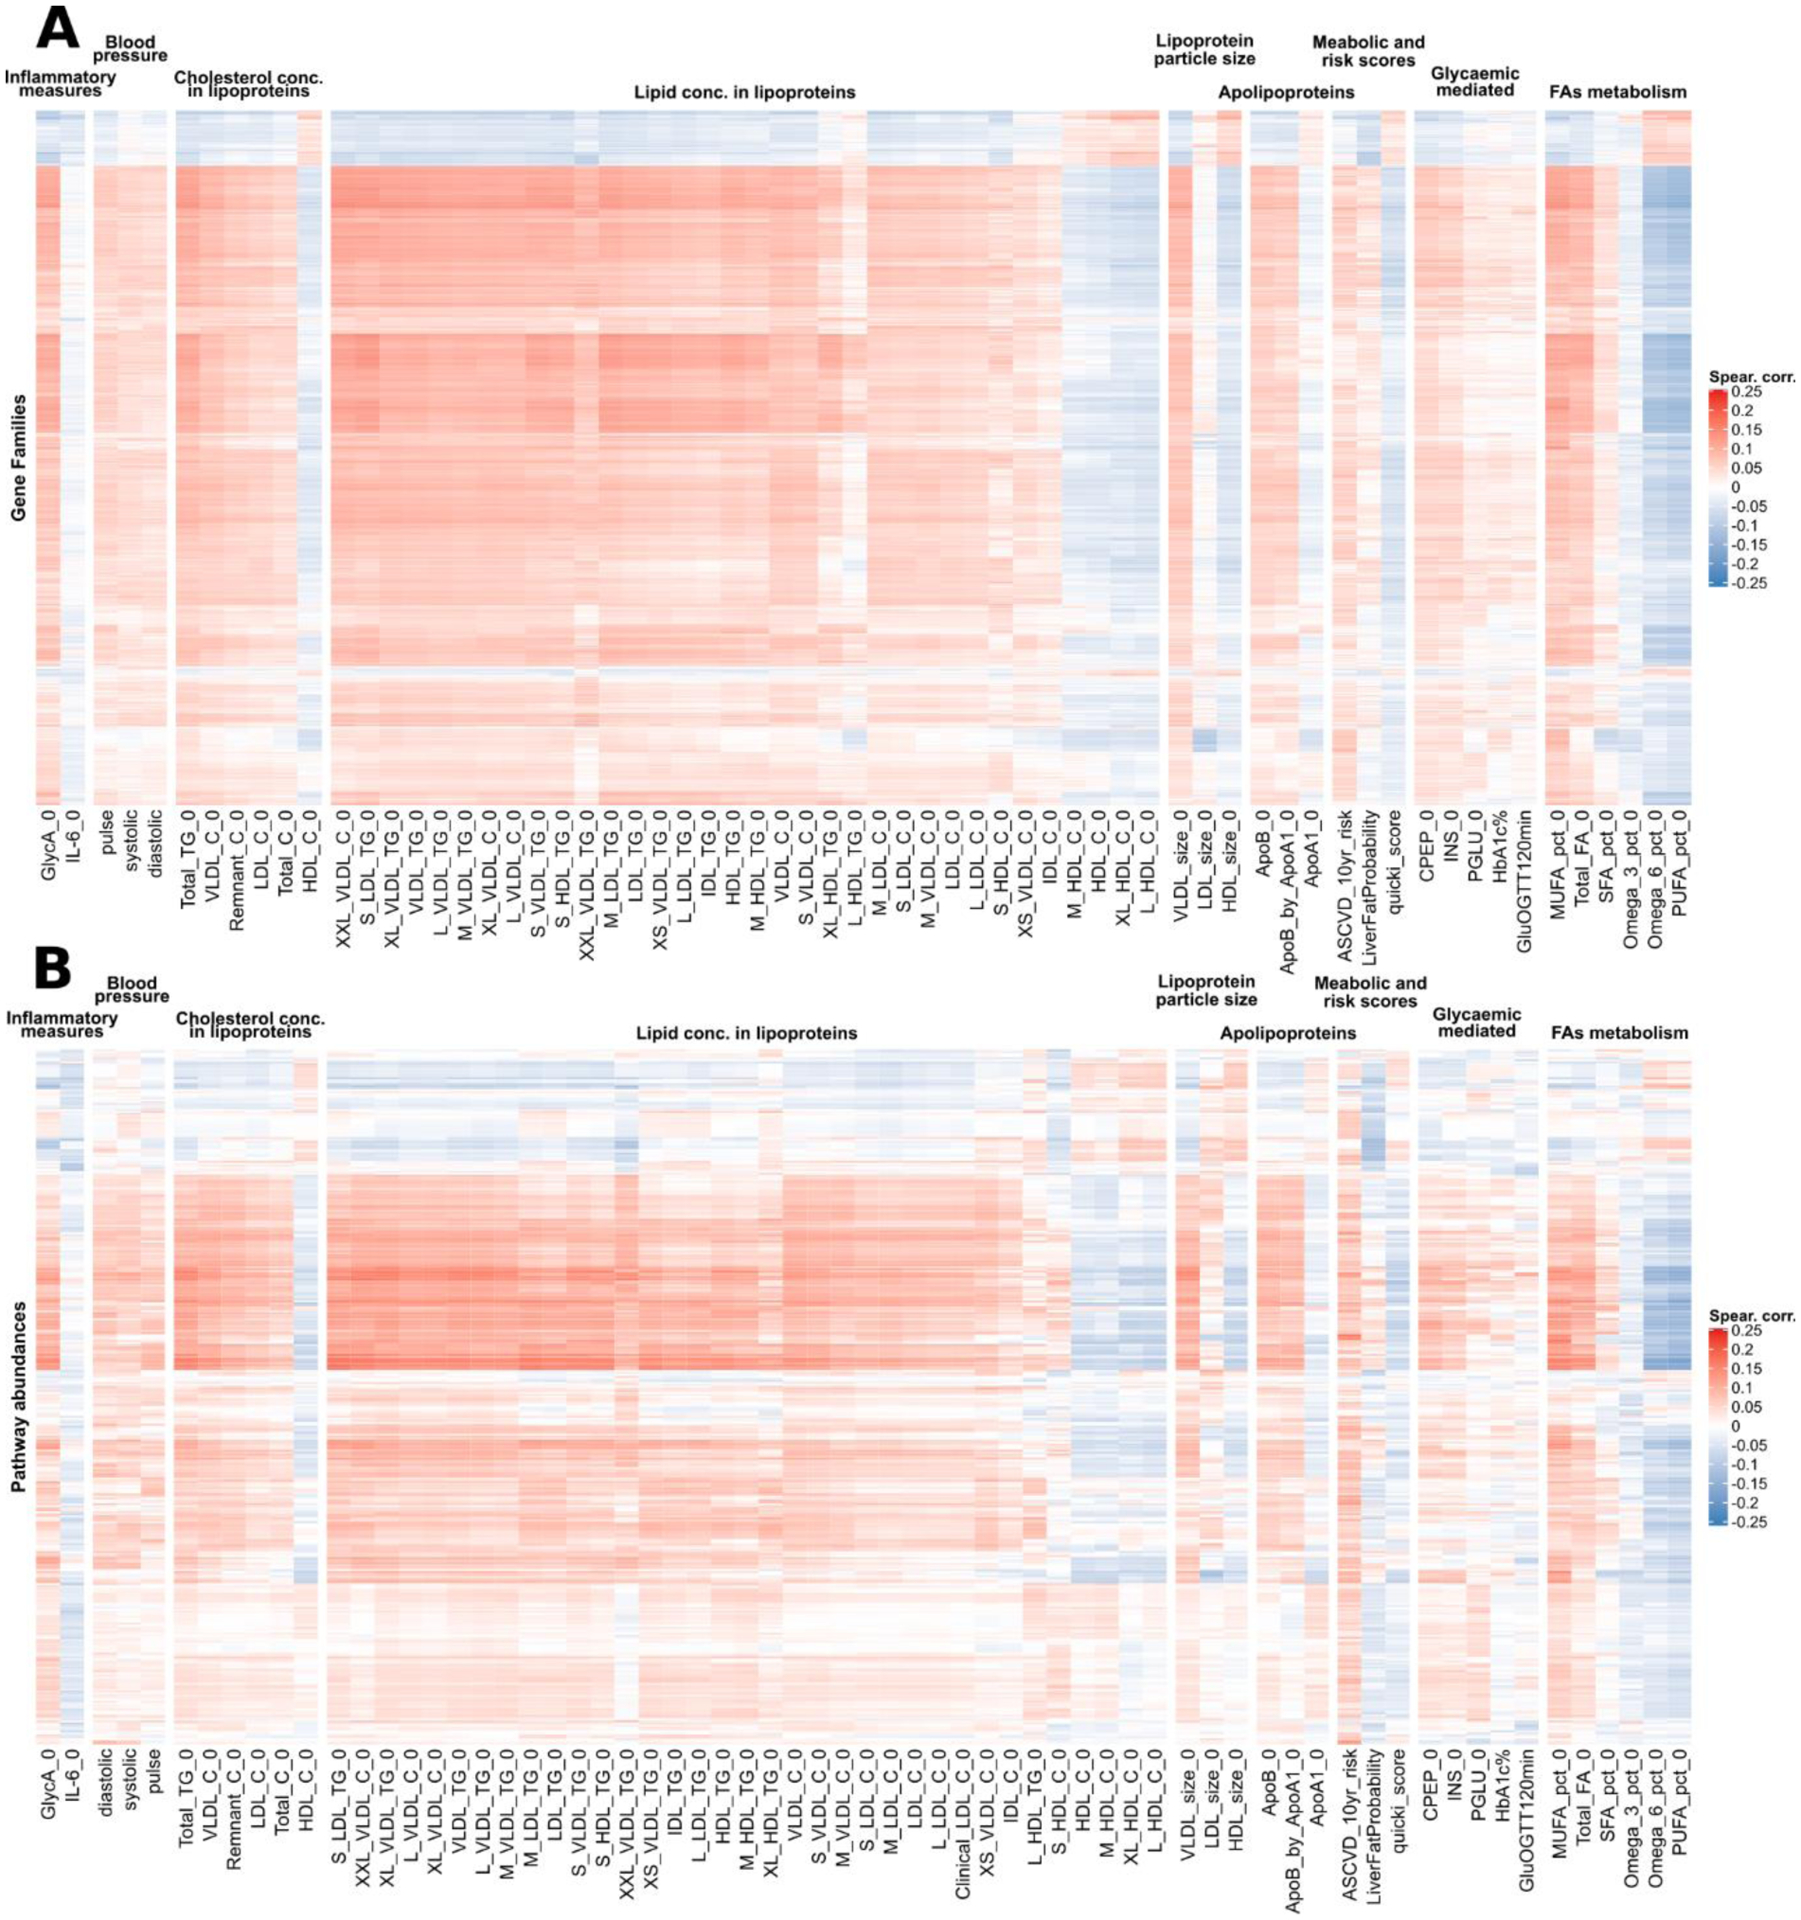
a, The heatmap shows gene families correlations with the set of metadata presented in Fig. 5a–c reporting the top 2,000 genes selected among those with at least 20% prevalence on their number of significant correlations (q < 0.2). Gene families’ correlations are showing the same clusters as the species-level correlations in Fig. 5a–c. b, The heatmap shows pathway abundances correlations with the set of metadata presented in Fig. 5a–c reporting all the pathways at 20% prevalence (349 in total). Pathway abundances correlations are showing the same cluster structure as the species-level correlations in Fig. 5a–c.