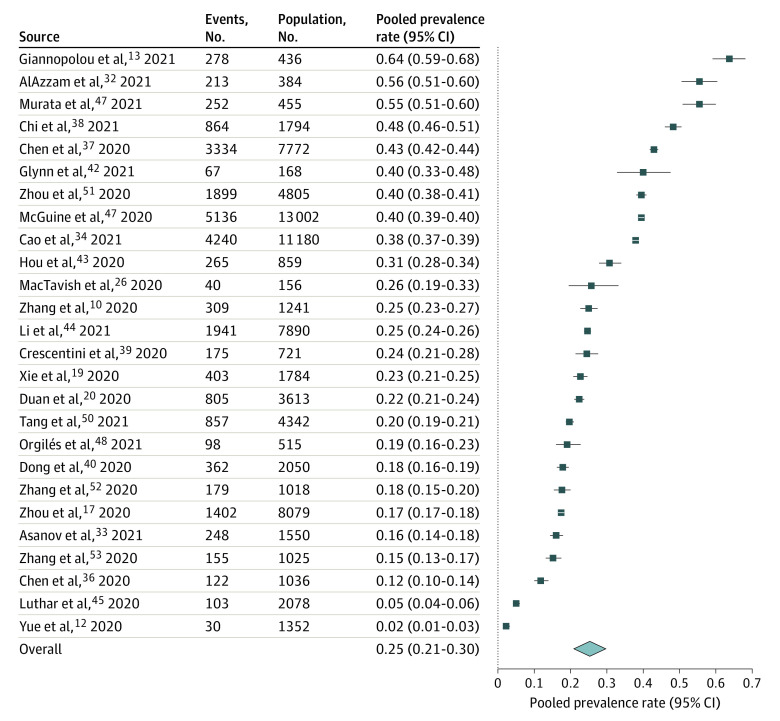
Figure 1. Forest Plots of the Pooled Prevalence of Clinically Significant Depressive Symptoms in Youth During the COVID-19 Pandemic.
Contributing studies for clinically elevated depression symptoms are presented in order of largest to smallest prevalence rate. Square data markers represent prevalence rates, with lines around the marker indicating 95% CIs. The diamond data marker represents the overall effect size based on included studies.

