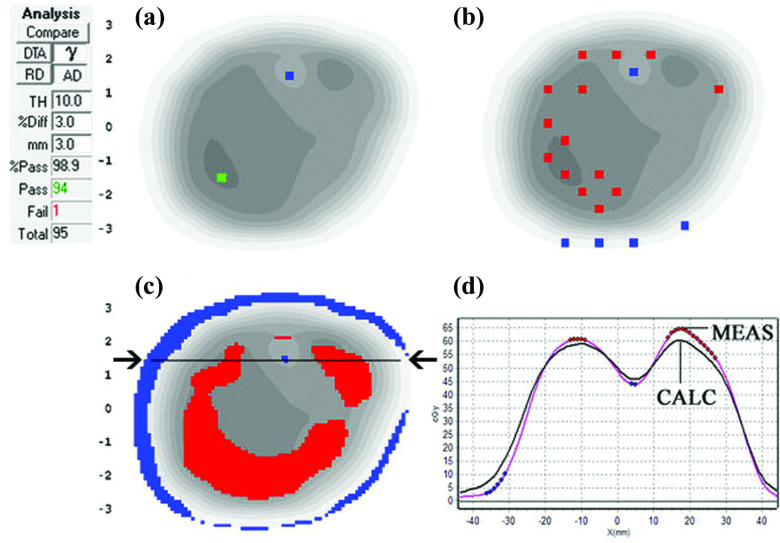
FIG. 3.
(a) 3%G/3 mm gamma failing points and (b) 2%L/2 mm gamma failing points based on a diode array at 5 cm depth, 100 cm SDD. In both (a) and (b), the visible dots represent failing points. (c) 2%L/2 mm gamma failing points for EPIDose analysis at same virtual depth and (d) dose profile through the horizontal line indicated by the arrows in panel (c), with the black line extracted from the TPS dose grid and the line with dots highlighted from the measurement.

