FIG. 4.
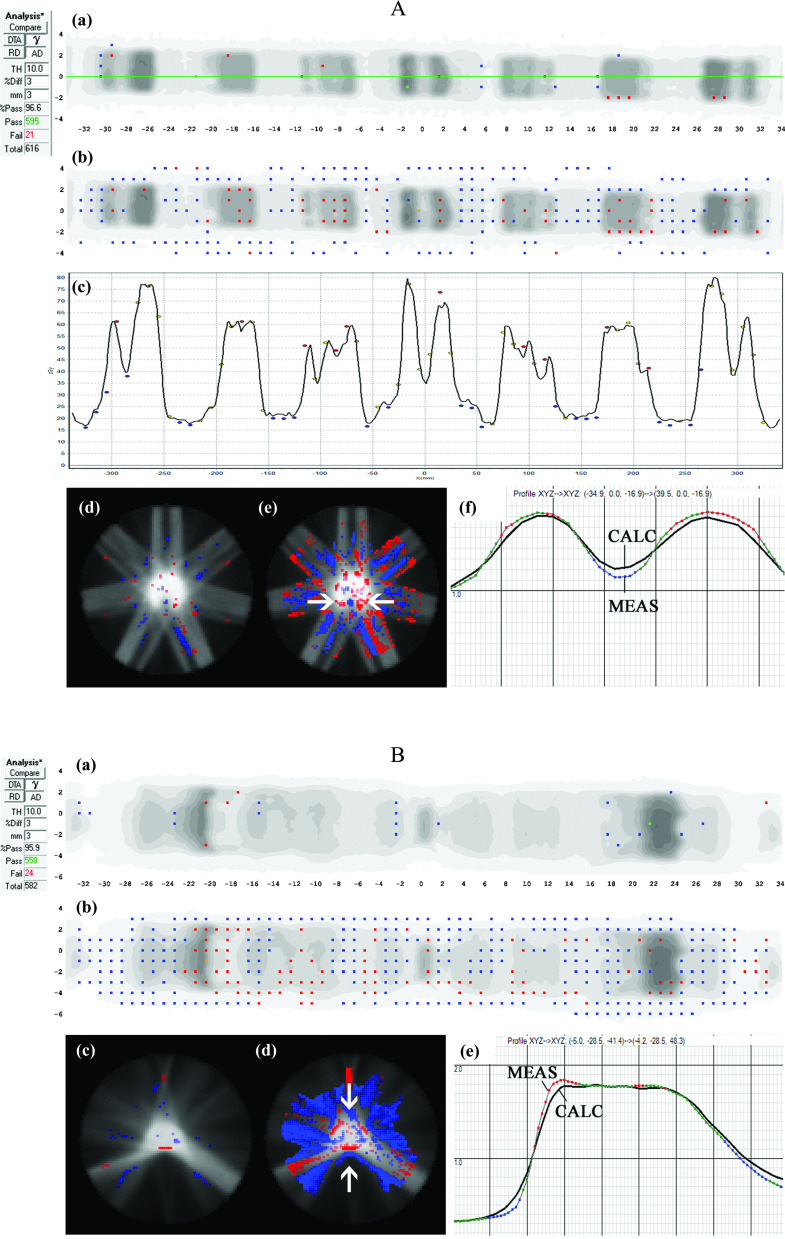
Case Study A (top): Seven-beam IMRT plan. (a) 3%G/3 mm gamma failing points over the ArcCHECK detector surface and (b) the same data highlighting points failing 2%L/2 mm gamma analysis. In panels (a) and (b), the visible dots represent failing points. (c) Dose profile over the central (Y = 0 mm) quasi-circular circumference of detectors (location of profile shown by the horizontal line in panel (a) showing meas > calc in peaks and meas < calc in valleys of dose, with the black line a profile interpolated through the TPS dose grid and the dots representing dose measured by the point detectors. (d) 3D MGDR reconstructed dose vs TPS dose for central axial plane, showing points failing 3%G/3 mm gamma analysis, and (e) the same data analyzed with 2%L/2 mm which introduces sensitivity enough to highlight the dose gradient differences. In panels (d) and (e), shaded regions indicate MGDR > calc or MGDR < calc. (f) Dose profile through the horizontal line indicated with arrows in panel (a), also showing the dose gradient differences, with the solid line representing the TPS dose and dotted line the reconstructed measurement. (b) Case Study B: The same TPS model as Case Study A of Fig. 4 analyzed for a single arc VMAT plan. (a) 3%G/3 mm gamma failing points over the ArcCHECK detector surface and (b) the same data highlighting points failing 2%L/2 mm gamma analysis. In panels (a) and (b), the visible dots represent failing points. (c) 3D MGDR reconstructed dose vs TPS dose for central axial plane, showing points failing 3%G/3 mm gamma analysis and (d) the same data analyzed with 2%L/2 mm which introduces sensitivity high enough to highlight the dose gradient differences. (e) Dose profile through the horizontal line indicated with arrows in panel (a), also showing the dose gradient differences, with the black line the TPS dose and dotted line the reconstructed measurement.

